A bag contains six green balls, eight red balls, and three yellow balls. If one ball is randomly selected from the ball, which of the following is the probability that the ball is green?
10/17
3/17
2/17
6/17
Correct Answer : D
The probability of finding a green ball is given by
Total number of balls in the bag=6+8+3=17 balls
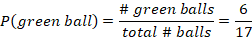
Therefore, the probability of drawing a green ball from the bag containing 17 balls is 6/17.
TEAS 7 Exam Quiz Bank
HESI A2 Exam Quiz Bank
Find More Questions 📚
Teas 7 Questions: We got the latest updated TEAS 7 questions
100% Money Refund: 100% money back guarantee if you take our full
assessment pass with 80% and fail the actual exam.
Live Tutoring: Fully customized live tutoring lessons.
Guaranteed A Grade: All students who use our services pass with 90%
guarantee.
Related Questions
Correct Answer is A
Explanation
Given the equation A(f)=92+2f
To find the value of A(f), we need to manipulate the value of f. In this case, f is the independent variable while A(f) is the dependent variable.
Correct Answer is A
Explanation
We are tasked to find the stock price on Thursday from the given information. Here, we need to find the stock of each day from the price increase or decrease. If the price increases, we add to the previous day’s price and subtract if the price decreases.
Monday’s stock price=$65.50
Tuesday’s stock price is Monday’s plus $1.50=65.50+1.50=$67.00
Wednesday’s stock price went down by $2.57 from Tuesday’s=67.00-2.57=$64.43
Thursday’s stock price went up by $2.25 from Wednesday’s =64.43+2.25=$66.68
From the above evaluation, the stock price on Thursday was $66.68
Correct Answer is A
Explanation
A. A=w(2w+1)
Explanation
The area of a rectangle is given by the formula:
A=length×width
Given that the length is one more than twice the width, we can express it as:
Length=2w+1
The width is simply w.
Now, substituting these into the area formula:
A=w(2w+1)
Thus, the correct answer is:
A=w(2w+1)
Correct Answer is C
Explanation
We follow the order of operations to solve the given expression. The order of operations is PEMDAS:
- Parentheses
- Exponents
- Multiplication and Division (in order from left to right)
- Addition and Subtraction (in order from left to right)
First, we start with the numerator and solve it as follows
[3(6+5*4)]
We start with multiplication in parenthesis, 5*4=20. The expression becomes
[3(6+20)]
Then, we conduct the addition in parenthesis 6+20=26. Then, the expression becomes
[3(26)]=3*26=78
Now, we solve for denominator, which is 26/2=13.
Thus, the expression is reduced into
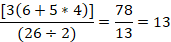
The expression reduces into 6.
Correct Answer is D
Explanation
We use the relation 1 L=1000 mL to convert L to mL.
The two options for converting between L and mL are

And

We use the first option to convert 6.5 L to mL as follows:
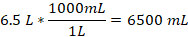
Thus, 6.5 L is 6500 mL.
Correct Answer is B
Explanation
The number of cups of milk to make a bigger batch, we proceed as follows:
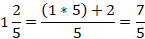
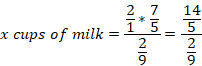
First convert the mixed number 1 2/5 as
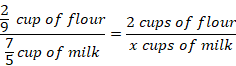
Then, we let the unknown number of cups of milk to be x and we set a proportion equation with number cups of floor as numerator and cups of milk as denominator
Find the value of x by cross-products

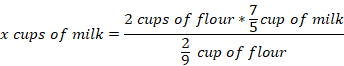
2 as a fraction is 2/1 which is then used to find the product of the numerator as follows.
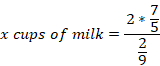
Per means division. The above equation becomes
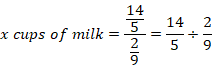
When dividing fractions, we multiply the first fraction with the reciprocal of the second. The reciprocal of 2/9 is 9/2. Thus
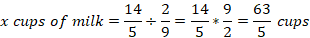
The numbers of cups of milk required is 63/5, which when converted to mixed fraction becomes 12 3/5.
Correct Answer is D
Explanation
Percentages are fractions with denominator equal to 100. To convert a percent to decimal form, divide the value by 100.
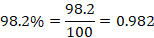
The decimal form of 98.2% is 0.982.
Correct Answer is A
Explanation
The length of the chair could be appropriately measured in centimeters. Kilometers are used to measure long distances while micrometers could be used to measure the length of small microorganism in microbiology lab. However, milligrams are used to measure the masses of small quantities.
Correct Answer is C
Explanation
Here we utilize the dimensional analysis of units of measurement of length to convert yards to cm as follows
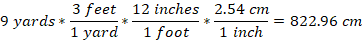
9 yards is equal to 822.96 cm, which is about 823 cm.
Correct Answer is B
Explanation
The number of boxes is determined by volume of the room divided by volume of one box.
Number of boxes

Therefore, about 24 boxes can be stacked in the room.
This question was extracted from the actual TEAS Exam. Ace your TEAS exam with the actual TEAS 7 questions, Start your journey with us today
Visit Naxlex, the Most Trusted TEAS TEST Platform With Guaranteed Pass of 90%.
Money back guarantee if you use our service and fail the actual exam. Option of personalised live tutor on your area of weakness.