A bucket can hold 3 L. How many ml can the bucket hold?
3000 mL
300 mL
30 mL
0.003 mL
Correct Answer : A
to change L to mL we use the following options of interconversions:

Or

Since we are needed to change L to mL, use the second option.
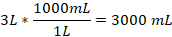
Thus, a bucket can hold 3000 mL which is equal to 3 L.
TEAS 7 Exam Quiz Bank
HESI A2 Exam Quiz Bank
Find More Questions 📚
Teas 7 Questions: We got the latest updated TEAS 7 questions
100% Money Refund: 100% money back guarantee if you take our full
assessment pass with 80% and fail the actual exam.
Live Tutoring: Fully customized live tutoring lessons.
Guaranteed A Grade: All students who use our services pass with 90%
guarantee.
Related Questions
Correct Answer is C
Explanation
an independent variable is one that when changed, causes the other variable(s) to change. In our case, calories burned, distance traveled, energy used increase when cycling speed increases.
Therefore, speed is the independent variable while other variables are dependent.
Correct Answer is C
Explanation
In this problem, we assume the truck carries a whole cargo. Thus, total weight is 516 lb divided by 1/3. Thus,

We change the division sign to product and multiply 516 by reciprocal of 1/3. Then,
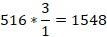
The weight of the cargo will be 1548 lbs.
Correct Answer is A
Explanation
we are needed to find the amount Lana is left with after spending and investing the rest using the given information.
Amount Lana spends = 80% of $60= 80/100 *60 = $48
Amount left to invest = $(60-48) = $12
Lana is left with $12, which she invests and earns a profit of 80%.
Profit earned = 80% of $12 = 80/100 * 12= $9.20
So, Lana will have $12 + $9.20 = $21.60
Correct Answer is A
Explanation
To find the least common denominator (LCD) of the fractions 1/2, 2/3, and 4/5, follow these steps:
Step 1: Identify the denominators
The denominators are 2, 3, and 5.
Step 2: Find the least common multiple (LCM)
The LCM of 2, 3, and 5 is the smallest number that all three denominators divide into evenly.
- Prime factorization:
- 2=2
- 3=3
- 5=5
Since 2, 3, and 5 are all prime numbers, their LCM is:
2×3×5=30
Correct Answer is B
Explanation
When dealing with percent problems, the following is utilized to find the unknown variable.
- Is means equals
- Of means multiply
- What means unknown (variable)
From the problem above, we are looking for the amount of gratuity the couple can leave.
Let t be the amount of gratuity. Translating into an equation, we have
The gratuity is 15% of the total bill, which becomes
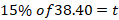
Here, of means multiply and we also convert percent into decimal before multiplying.
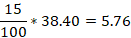
So, the value of t=5.76
Thus, a couple will leave a gratuity of $5.76, which is about $6.00.
Correct Answer is D
Explanation
The length of the unknown side of the rectangle can be found by using the Pythagoras theorem. We label the triangle from the given data as shown below
Let the unknown length be x.
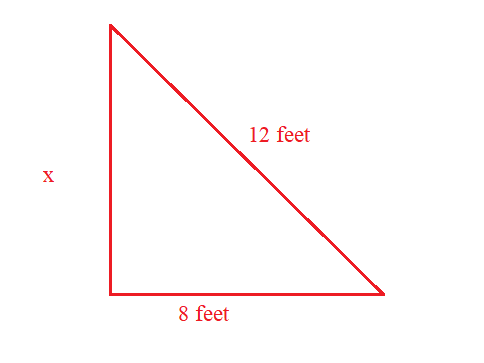
Applying the Pythagoras theorem, the value of x is found as:
\(a ^2 +b ^2 =c ^2\)
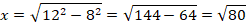

The unknown length of the triangle is approximately 8.9 feet.
Correct Answer is B
Explanation
here we use the US customary system to convert between yards and feet. We use the conversion 1 yard =3 feet. Then, 6 yards to ft is found as
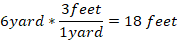
Thus, 6 yards is equal to 18 ft.
Correct Answer is A
Explanation
from the given estimations, we can find the actual addition of the numbers and see a trend the student utilizes to find their estimates. The exact sum is as follows
24+190=214
151+319=470
974+1022=1996
From the above evaluation, we can clearly see the students approximates the value in the ones values. So, in the problem we need to approximate 452+5017.
452+5017=5469
We can approximate 5469 based on the provided choices to 5470.
Correct Answer is C
Explanation
we need to find the net income of the nurse in 4 weeks from the weekly net income.
Weekly net income=gross income-total tax
Total tax=federal income tax+state income tax+Social Security tax
Total tax=$(83.00+38.00+79.00)
Total tax=$200.00
Weekly net income=$(800.00-200.00)=$600.00
In one week, the net income of the nurse is $600.00 and in 4 weeks the nurse will a net income of:
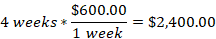
The nurse will earn $2,400.00 in 4 weeks after taxes are deducted.
Correct Answer is C
Explanation
to find the average time the athlete runs in 1 mile, find total time divided by total distance covered.
Total distance=4+4=8 miles
Total time=28+32 =60 minutes
From the above, the athlete runs 8 miles in 60 minutes, so the athlete will take how minutes to cover 1 mile.
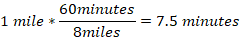
So, the athlete covers 1 mile in 7.5 minutes.
This question was extracted from the actual TEAS Exam. Ace your TEAS exam with the actual TEAS 7 questions, Start your journey with us today
Visit Naxlex, the Most Trusted TEAS TEST Platform With Guaranteed Pass of 90%.
Money back guarantee if you use our service and fail the actual exam. Option of personalised live tutor on your area of weakness.