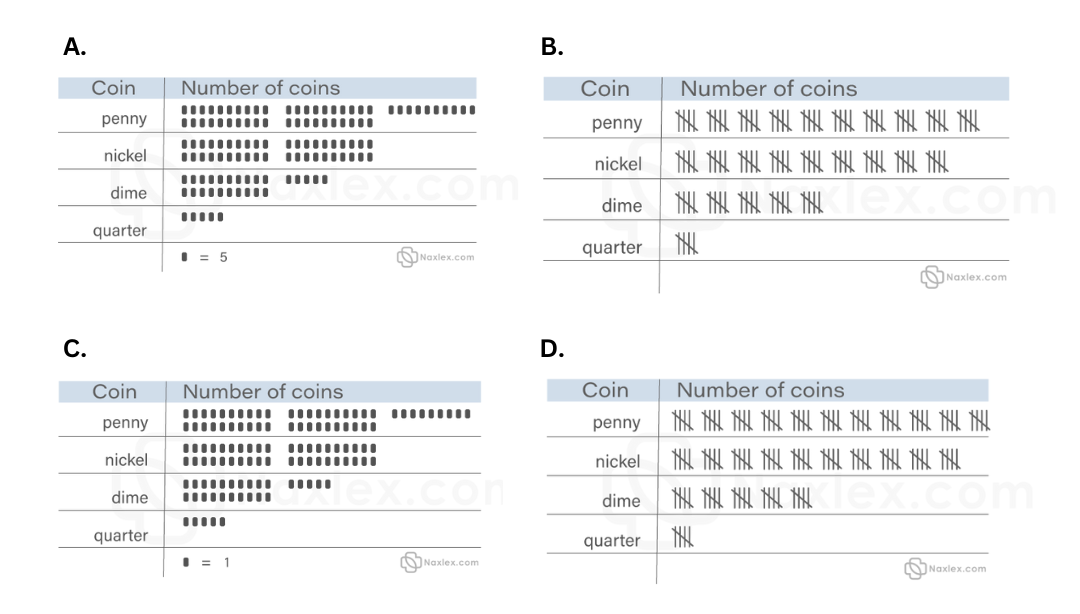
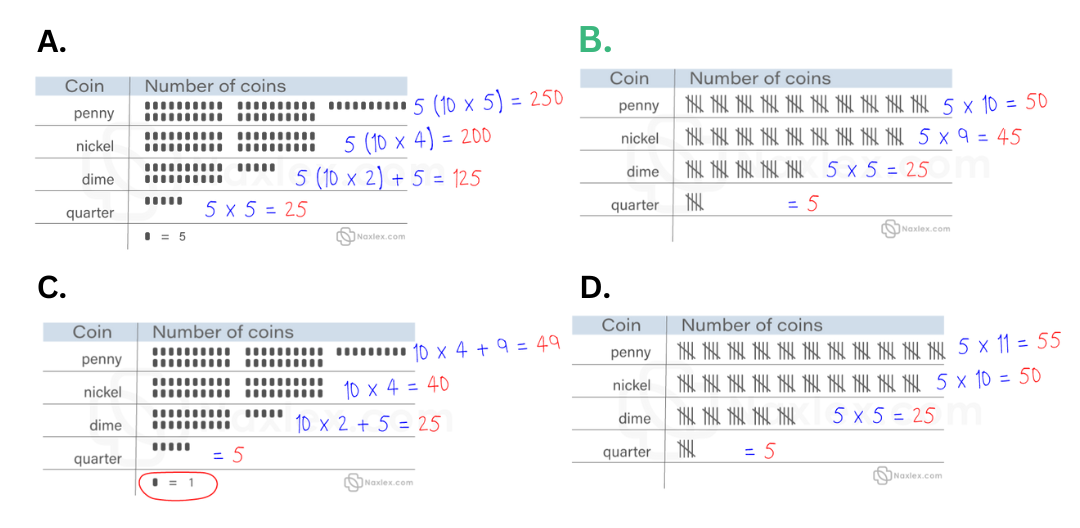
A child has collected 50 pennies, 45 nickels, 25 dimes, and 5 quarters. Which of the following charts accurately organizes the number of coins?
A
B
C
D
Correct Answer : B
In this scenario, we use the given scale in the charts to find the number of each coin and selected the right number of coins the student collected. The second options shows that the child collected 50 pennies, 45 nickels, 25 dimes, and 5 quarters.
TEAS 7 Exam Quiz Bank
HESI A2 Exam Quiz Bank
Find More Questions 📚
Teas 7 Questions: We got the latest updated TEAS 7 questions
100% Money Refund: 100% money back guarantee if you take our full
assessment pass with 80% and fail the actual exam.
Live Tutoring: Fully customized live tutoring lessons.
Guaranteed A Grade: All students who use our services pass with 90%
guarantee.
Related Questions
Correct Answer is B
Explanation
We are told to find the area of the pizza given its diameter. The pizza is in circular form, and its area is found as:

However, we are not given r, which is the radius of the circle. But we can find it from the given diameter as
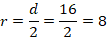
Substituting r=8 in the equation of the area of a circle
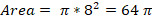
Thus, the area of the pizza is 64  in2.
in2.
NOTE:  (Pi) remains as a symbol because values of Pi can vary from 22/7 to 3.1415 to 3.14 and so forth.
Correct Answer is A
Explanation
To find the least common denominator (LCD) of the fractions 1/2, 2/3, and 4/5, follow these steps:
Step 1: Identify the denominators
The denominators are 2, 3, and 5.
Step 2: Find the least common multiple (LCM)
The LCM of 2, 3, and 5 is the smallest number that all three denominators divide into evenly.
- Prime factorization:
- 2=2
- 3=3
- 5=5
Since 2, 3, and 5 are all prime numbers, their LCM is:
2×3×5=30
Correct Answer is C
Explanation
we follow the order operations to solve for the unknown value of x.
2(4x+3)=7x+5
Open the bracket on the LHS by multiplying each term by 2
(2*4x)+(2*3)=7x+5
8x+6=7x+5
Subtract 6 from both sides
8x+6-6=7x+5-6
8x=7x-1
Subtract 7x on both sides
8x-7x=7x-7x-1
X=-1
Thus, the value of unknown value of x is -1.
Correct Answer is A
Explanation
The initial step is to establish the relationship between area of a circle and the radius. The area of the circle is given by the formula

Now, substituting the 49 π in2 in place of A in the equation above becomes:

We want to find r, therefore, we rearrange the equation as

Divide both sides by 


Take square root both sides of the equation


The radius of the circle is 7 in, and the circumference of the circle is determined as follows
Substituting the value of r=7 becomes

Thus, the circumference of a circle whose area is 49  in2 is 14
Correct Answer is D
Explanation
In order to solve for the value of x, we use the order of operations as follows:
The first step is to divide both sides by 4


Since 5 is subtracted, we add 5 to both sides to eliminate it from the left-hand side of the equation

Thus, the value of x is 7.
Correct Answer is D
Explanation
The length of the unknown side of the rectangle can be found by using the Pythagoras theorem. We label the triangle from the given data as shown below
Let the unknown length be x.
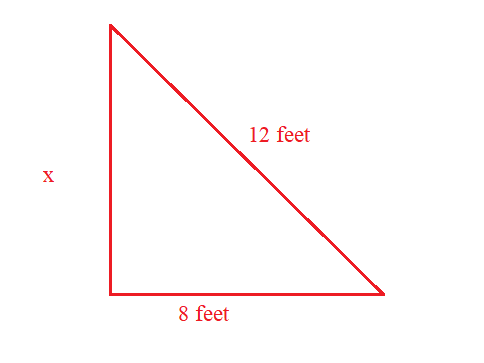
Applying the Pythagoras theorem, the value of x is found as:
\(a ^2 +b ^2 =c ^2\)
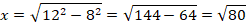

The unknown length of the triangle is approximately 8.9 feet.
Correct Answer is C
Explanation
To simplify the expression:
12+3×4−1+23
Step 1: Follow the order of operations (BODMAS)
Multiplication first:
3×4=12
23 = 2×2×2=8
Now the expression becomes:
12+12−1+8
Step 2: Perform addition and subtraction from left to right
- 12+12=24
- 24−1=23
- 23+8=31
The correct answer is 31.
Correct Answer is C
Explanation
To solve this equation, we use a calculator and find the product as:
2.50*0.25=0.625
Correct Answer is A
Explanation
from the given estimations, we can find the actual addition of the numbers and see a trend the student utilizes to find their estimates. The exact sum is as follows
24+190=214
151+319=470
974+1022=1996
From the above evaluation, we can clearly see the students approximates the value in the ones values. So, in the problem we need to approximate 452+5017.
452+5017=5469
We can approximate 5469 based on the provided choices to 5470.
Correct Answer is B
Explanation
When dealing with percent problems, the following is utilized to find the unknown variable.
- Is means equals
- Of means multiply
- What means unknown (variable)
From the problem above, we are looking for the amount of gratuity the couple can leave.
Let t be the amount of gratuity. Translating into an equation, we have
The gratuity is 15% of the total bill, which becomes
Here, of means multiply and we also convert percent into decimal before multiplying.
So, the value of t=5.76
Thus, a couple will leave a gratuity of $5.76, which is about $6.00.
This question was extracted from the actual TEAS Exam. Ace your TEAS exam with the actual TEAS 7 questions, Start your journey with us today
Visit Naxlex, the Most Trusted TEAS TEST Platform With Guaranteed Pass of 90%.
Money back guarantee if you use our service and fail the actual exam. Option of personalised live tutor on your area of weakness.