A farmer is planning for a growing season and want to know the trend in amount of rainfall in his area. He obtains rainfall falling in the first 5 months of the year as shown in the above table. Which of the following would best display the data?
|
Month |
January |
February |
March |
April |
May |
|
Rainfall (mm) |
20 |
6 |
14 |
28 |
34 |
Scatter plot
Pie chart
Line graph
Bar graph
Correct Answer : D
Based rainfall falling for the first 5 months, a bar graph will give a great display for the farmer to decide when start planting. The horizontal scale will represent months of the year and vertical scale will present the amount of rainfall falling.
TEAS 7 Exam Quiz Bank
HESI A2 Exam Quiz Bank
Find More Questions 📚
Teas 7 Questions: We got the latest updated TEAS 7 questions
100% Money Refund: 100% money back guarantee if you take our full
assessment pass with 80% and fail the actual exam.
Live Tutoring: Fully customized live tutoring lessons.
Guaranteed A Grade: All students who use our services pass with 90%
guarantee.
Related Questions
Correct Answer is B
Explanation
The initial step is to convert the decimal numbers into fractions.
5.2 becomes 52/10
5.15 becomes 515/100
Next, find the least common denominator of 3, 10, and 100, which is 300. We use this value and multiply each fraction.
7/3*300=700
52/10*300=1560
13/3*300=1300
515/100*300=1545
From the above, 1560 is the greatest value which corresponds to 52/10. Thus, 5.2 is the greatest value of all the choices given.
Correct Answer is C
Explanation
To convert 514 to a percentage:
Step 1: Convert the mixed number to a decimal
514=5+14=5+0.25=5.255
Step 2: Convert to a percentage
Multiply by 100:
5.25×100=525%
Correct Answer is D
Explanation
To solve the equation this equation, we compute the multiplication of the two numbers using the calculator
3.60 * 0.75 = 2.7
Correct Answer is B
Explanation
The median of a data set is found in two ways:
For an odd data set, the median fall in the (N+1)/2 th position.
For an even data set, the median is the average of the element in the (N/2)th and (N+1)/2 th positions.
To find the median of the given data set, we need to arrange the elements from the smallest to the largest as follows:
12, 12, 16, 18, 19, 22, 23, 24, 26, 35, 35
There are 11 elements in the data set. 11 is an odd number and the median fall in the (N+1)/2 th position.
Median =(11+1)/2=12/2=6 th position.
From the organized data, the element in the 6th position is 22, which is the required median for the data set.
Correct Answer is C
Explanation
Let x be the original price of the recliner.
Step 1: Apply the 30% discount
The recliner is on sale for 30% less than the original price:
SalePrice=x−0.3x=0.7x
Step 2: Apply the 25% coupon discount
The consumer gets an additional 25% off the sale price:
FinalPrice=0.7x−0.25(0.7x) = 0.525x
Step 3: Solve for x
The consumer paid $237, so:
0.525x=237
x≈451.43x
Rounding to the nearest dollar, the original price is $451.
Correct Answer is D
Explanation
We are required to find the percent equivalent of the given fraction.
We multiply 7/8 by 100 to convert it to percent. You convert fraction to percent.

Thus 7/8 is equal to 87.5%.
Correct Answer is C
Explanation
We are asked to find mL equivalent in 1.5 teaspoons. To carry out the operations, we utilize dimensional analysis to solve this problem as follows.
Converting between teaspoon and mL uses the following conversions:

Or

Since we want to remain with mL, use the second option and proceed as follows.
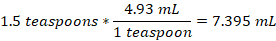
Thus, 1.5 teaspoons is equal to 7.395 mL
Correct Answer is C
Explanation
Correlation of two variables falls into:
Positive correlation: an increase in one variable causes another variable to increase
Negative correlation: an increase in one variable causes another one to decrease
No correlation: a change in one variable does not cause any response in another variable.
From the given choices
Option a is no correlation
Option b is a no correlation
Option c is a negative correlation
Option d is a positive correlation
Correct Answer is C
Explanation
From the given data, we can draw the following triangle by letting the unknown length to be p.
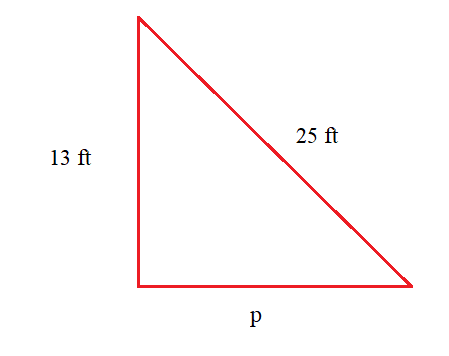
We apply the Pythagoras theorem, the value of p:
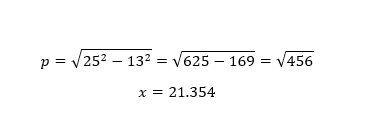
The unknown length of the triangle is about 21.4 feet.
Correct Answer is C
Explanation
We need to find the amount Lana left after spending and investing another.
Lana spends=70% of $90=70/100 * 90 = $63
Amount left after spending=$(90-63) = $27
Lana is left with $27, which she will invest and earns a profit of 60%.
Profit earned=60% of $27 = 60/100 * 27 = $16.20
Therefore, Lana will have $27 + $16.20 = $43.20
This question was extracted from the actual TEAS Exam. Ace your TEAS exam with the actual TEAS 7 questions, Start your journey with us today
Visit Naxlex, the Most Trusted TEAS TEST Platform With Guaranteed Pass of 90%.
Money back guarantee if you use our service and fail the actual exam. Option of personalised live tutor on your area of weakness.