A teacher has asked all the students in the class which days of the week they get up after 8 a.m. Which of the following is the best way to display the frequency for each day of the week?
Pie graph
Bar graph
Histogram
Scatterplot
Correct Answer : B
The best way to display the frequency of each day of the week when students get up after 8 a.m. is by using a bar graph. Bar graphs are well-suited for representing categorical data, where each day of the week is a separate category, and the height of each bar corresponds to the count or frequency of students waking up late on that specific day.
Note: Histograms, on the other hand, are more appropriate for visualizing continuous or numerical data and are not ideal for categorical data like days of the week. Histograms are useful for understanding the distribution of data, identifying patterns, and assessing the shape of the data distribution, such as whether it's normally distributed, skewed, or has multiple modes.
As you can see below, the Histogram is used to depict a pattern/continuous data. While a bar graph does just fine even with discrete data.


TEAS 7 Exam Quiz Bank
HESI A2 Exam Quiz Bank
Find More Questions 📚
Teas 7 Questions: We got the latest updated TEAS 7 questions
100% Money Refund: 100% money back guarantee if you take our full
assessment pass with 80% and fail the actual exam.
Live Tutoring: Fully customized live tutoring lessons.
Guaranteed A Grade: All students who use our services pass with 90%
guarantee.
Related Questions
Correct Answer is D
Explanation
We convert the given weight in pounds to ounces and find total weight. 1 pound=16 ounces, which we interpret as

Or

Use the second option to convert pounds to ounces

Now, we can ounces to ounces as: 48 oz + 5 oz= 53 oz
Therefore, 3 pounds, 5 ounces is equal to 53 oz
Correct Answer is D
Explanation
Round trip means to and from, which is twice the distance from home to a medical facility.
In one day, the round trip=19+19=38 miles
So, in 22 days, the round trip=38*22=836 miles.
The patient will cover 836 miles in 22 days.
Correct Answer is B
Explanation
we are asked to change 400 mg to g. We use the conversion 1g=1000mg, which we can write as:

So, 400 mg to g becomes
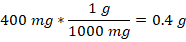
Correct Answer is B
Explanation
In the simple interest, we utilize the following formula to find the simple interest after a period of time in years.
I=P*r*t
I is the interest
P=Principal or initial deposit
r=rate
t=time in years
From the given problem, P=$600, r=6%=6/100=0.06, t=5 years. Then
I=$600*0.06*5=$180
After 5 years, Pat will earn an interest of $180.
Correct Answer is A
Explanation
We need to find the length of the rectangle from the given area and width of the rectangle. Let L be length if the rectangle. Then,
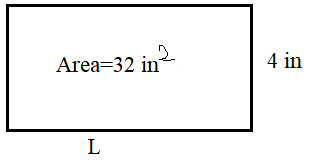
Area of rectangle=Length*width
Substituting area=32 in2 and w=4 inches
32=L*4
32=4L
Divide both sides by 4
32/4=4L/4
8=L
The length of the rectangle is 8 inches.
Correct Answer is A
Explanation
to do a comparison of the given data set, we convert the fraction numbers into the approximate decimals.
4/3=1.333
2720=1.35
Now, we have 1.333, 1.35, 1.369, 1.357. These numbers are arranged from the smallest to the largest number, we look at the number in the second decimal place value
1.333 the number in second decimal place value is 3
1.35 the number in third decimal place value is 5
1.369 the number in third decimal place value is 6
1.357 the number in third decimal place value is 5
However, 1.35 and 1.357 have 5 in the second-place vale. We use the ird place value to compare the two number:
1.35 is same as 1.350 and the number in the third-place value is 0
1.357 the number in the third-place value is 7
Now, 0 is less than 7, and thus 1.35 is less than 1.357
Overall, 3 is less than 5, and 5 less than 6 and the provided numbers can be arranged from the smallest to the largest as:
1.333, 1.35, 1.357, 1.369
Thus, the corresponding given numbers organized from the smallest to the largest become:
4/3, 27/20, 1.357, 1.369
The greatest value is 1.369
Correct Answer is D
Explanation
Percentages always add up to 100%. If we let x be the percent of graduates working for jobs unrelated to law, then
74%+3%+2%+x=100%
79%+x=100%
Subtract 79% from both sides of the equation
79%-79%+x=100%
x=100%-79%
x=21%
So, the number of graduates working for jobs unrelated to law is 21%.
Correct Answer is B
Explanation
From the given scenario:
Initial charge is $40
Additional charge per circular cloth=$5c
Additional charge per rectangular cloth=$3.50r
Total cost = additional charge per circular rectangular cloths + Initial charge
Total cost, T = 5c + 3.5r + 40
Correct Answer is A
Explanation
to solve for x, we order like terms together and proceed as follows:
4x-3-5x=24
Add 3 to both sides of the equation
4x-3+3-5x=24+3
4x+3-3-5x=27
4x-5x=27
-x=27
Divide both sides by -1
-x/-1=27/-1
x= -27
Thus, the unknown value of x is -27
Correct Answer is B
Explanation
Here we are required to find the area of the square of sides 3.1 m. The square is a four-sided figure with each side equal and opposite sides making 90 degrees.
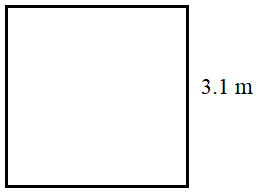
Area of the square =side*side
Side=3.1 m
Area of the square =3.1 m *3.1 m=9.61 m2
Note: 3.1 + 3.1 = 6.2 which is a wrong answer.
This question was extracted from the actual TEAS Exam. Ace your TEAS exam with the actual TEAS 7 questions, Start your journey with us today
Visit Naxlex, the Most Trusted TEAS TEST Platform With Guaranteed Pass of 90%.
Money back guarantee if you use our service and fail the actual exam. Option of personalised live tutor on your area of weakness.