A teacher has asked all the students in the class which days of the week they read after 9 pm. which of the following is the best way to display the percent of number of students for each day of the week?
Histogram
Pie graph
Scatter plot
Bar graph
Correct Answer : A
A histogram depicts the frequency of a one variable over the other while a bar graph is used to compare two variables with vertical axis representing the heights. Therefore, a histogram will be used to represent percent of the number of students reading after 9.
TEAS 7 Exam Quiz Bank
HESI A2 Exam Quiz Bank
Find More Questions 📚
Teas 7 Questions: We got the latest updated TEAS 7 questions
100% Money Refund: 100% money back guarantee if you take our full
assessment pass with 80% and fail the actual exam.
Live Tutoring: Fully customized live tutoring lessons.
Guaranteed A Grade: All students who use our services pass with 90%
guarantee.
Related Questions
Correct Answer is D
Explanation
The circumference of a circle is given by the formula:
C=πd
where:
- d=16 inches
- π=3.14
Calculate the Circumference:
C=3.14×16 =50.24inches
Correct Answer is A
Explanation
The number of boxes is found by volume of the room divided by volume of one box.
Number of boxes
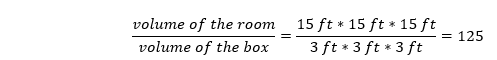
The room can hold 125 boxes.
Correct Answer is A
Explanation
percentages are fractions with denominator equal to 100. To get the decimal form of the percent given, e divide the value by 100.
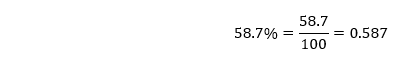
The decimal form of 58.7% is 0.587.
Correct Answer is A
Explanation
The perimeter of a shape is the sum of the lengths of all its sides.
Given Trapezoid:
- Top side: 10 cm
- Bottom side: 16 cm
- Left slant side: 5 cm
- Right slant side: 5 cm
Calculate the Perimeter:
10+16+5+5=36cm
Correct Answer is A
Explanation
To find the minimum length requires, we need to understand what slope in the question represents. The slope represents the ratio between the height to the length. Let x be the minimum length of the ramp. Then,
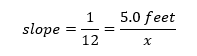
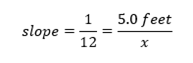
Now, we find the value of x by cross-products as follows
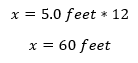
Thus, the minimum length required to provide access is 60 feet.
Correct Answer is A
Explanation
To determine the correct coordinates of the point shown on the graph, follow these steps:
- Identify the x-coordinate: Count the number of units the point is to the right or left of the y-axis. The point is at 5 on the x-axis.
- Identify the y-coordinate: Count the number of units the point is above or below the x-axis. The point is at -8 on the y-axis.
- The correct coordinates are (5, -8).
Looking at the answer choices:
- A. (5, -8) → Correct
- B. (-5, 8) → Incorrect
- C. (-8, 5) → Incorrect
- D. (8, -5) → Incorrect
Final Answer:
A. (5, -8)
Correct Answer is B
Explanation
In this problem, we need to compare the number of dimes to quarters.
If we let p be number of pennies in the bottle. Then,
Number of quarters in the bottle = 6p
Number of nickels in the bottle = 2p
Number of dimes in the bottle =5(2p)=10p
Now relating dimes to nickels, we have
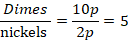
Thus, there are 5 times as many dimes as quarters in the box.
Correct Answer is D
Explanation
To find the required number of cups milk needed, we set a proportion equation with number of cups be numerator and cups of milk as denominator.
Let x be the number of cups of milk needed, then
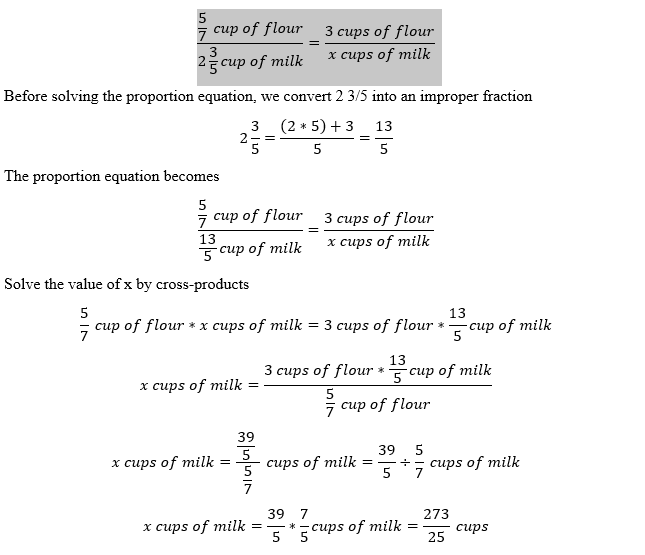
The numbers of cups of milk required is 273/25, which when converted to mixed fraction becomes 10 23/25.
Correct Answer is D
Explanation
the mean of a data set is the total scores divided by the number of tests.
Total test scores =80+68+74+87+96=405
Number of tests =5
Mean test score =405/5=81
The mean test score is 81.
Correct Answer is A
Explanation
To find the area of the room, we form an equation of find an equation relating the length and width of the rectangle. If we let the width of the room to be w, then
Width of the rectangle= w
Length of rectangle=(w+8)
Area of the rectangle, A= Length*width=(w+8)*w
A=w(w+8)
Thus, the area of the rectangular room is w(w+8).
This question was extracted from the actual TEAS Exam. Ace your TEAS exam with the actual TEAS 7 questions, Start your journey with us today
Visit Naxlex, the Most Trusted TEAS TEST Platform With Guaranteed Pass of 90%.
Money back guarantee if you use our service and fail the actual exam. Option of personalised live tutor on your area of weakness.