For a school's annual budget, the total amount of money spent on supplies (s) and textbooks (t) cannot exceed $12,000. Which of the following inequalities represents this scenario?
s + t >= $12,000
s + t > $12,000
s + t < $12,000
s + t <= $12,000
Correct Answer : D
We can interpret ‘cannot exceed” as less than ‘<’. Therefore, in our inequality, the symbol < must be included. Now let’s convert the word problem into a mathematical inequality.
Money spent on supplies=s
Money spent on textbooks=t
Total money spent=money spent on supplies + money spent on textbooks
Total money spent = s+t
But the money spent cannot exceed $12,000. Then,
s+t < $12,000.
However the money spent can still be equal to $12000, as it has not exceeded it.
Therefore, the required inequality is s + t <= $12,000.
TEAS 7 Exam Quiz Bank
HESI A2 Exam Quiz Bank
Find More Questions 📚
Teas 7 Questions: We got the latest updated TEAS 7 questions
100% Money Refund: 100% money back guarantee if you take our full
assessment pass with 80% and fail the actual exam.
Live Tutoring: Fully customized live tutoring lessons.
Guaranteed A Grade: All students who use our services pass with 90%
guarantee.
Related Questions
Correct Answer is A
Explanation
From the given problem,
49.5 pounds of fertilizer is needed to farm 1 acre of land. This can be interpreted as:

Or

Now we are needed to find the acres of land that will be farmed using 2000 pounds of fertilizers. To solve this, we use the second option as follows:
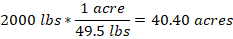
2000 pounds of fertilizers can farm approximately 40 acres of land.
Correct Answer is B
Explanation
from the provided table, the first option represents the amount of gas in gallons while the second column shows the distance in miles. Thus, (6, 144) will denote that the car can 144 miles by consuming 6 gallons of a gas.
Correct Answer is A
Explanation
Let xxx be the amount the friend paid for their car. The problem states:
48,000=2x−2,000
Step 1: Solve for x
Add 2,000 to both sides:
48,000+2,000=2x
Divide by 2:
x=25,000
Correct Answer is A
Explanation
A whole pizza is equivalent to 1. Then
One friend eats half of the pizza=1/2 of 1=1/2*1=1/2
Remaining amount of pizza to be shared=1-1/2=2/2-1/2=1/2
Now, three friends share ½ equally and each friend will get,
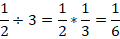
Thus, the three friends each share 1/6.
Correct Answer is C
Explanation
In this problem, to find one side of the square garden, we use the calculator to find the square root of 13. Thus
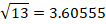
Thus, the approximate side of a square garden is about 3.6 ft
Correct Answer is D
Explanation
We can interpret ‘cannot exceed” as less than ‘<’. Therefore, in our inequality, the symbol < must be included. Now let’s convert the word problem into a mathematical inequality.
Money spent on supplies=s
Money spent on textbooks=t
Total money spent=money spent on supplies + money spent on textbooks
Total money spent = s+t
But the money spent cannot exceed $12,000. Then,
s+t <$12,000.
However the money spent can still be equal to $12000, as it has not exceeded it.
Therefore, therequired inequality is s + t <= $12,000.
Correct Answer is A
Explanation
To find the net force, we choose east direction as positive and west as negative. From this, we can present the tag of war in the diagram below.
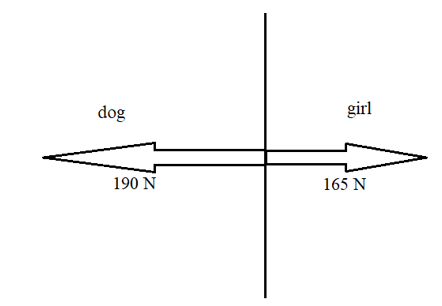
So, the force on the dog is -190 N and that of the girl is 165 N.
The net force is the sum of the two forces

The resulting force is negative, meaning it is in the west direction. Thus, the net force is 25 N to the west.
Correct Answer is D
Explanation
Round trip means to and from, which is twice the distance from home to a medical facility.
In one day, the round trip=19+19=38 miles
So, in 22 days, the round trip=38*22=836 miles.
The patient will cover 836 miles in 22 days.
Correct Answer is D
Explanation
We solve the problem by first finding the amount of gallons needed for the whole trip then find the cost of the gallon.
The car uses 1 gallon to cover 25 miles, which is same as:

Now, in 3000 miles, the car will use how many gallons of gasoline?
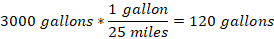
A trip of 3000 miles will need 120 gallons. And to find the cost of 120 gallons, we proceed as follows:
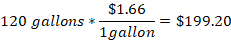
The family will spend $199.20 to drive for 3000 miles.
Correct Answer is D
Explanation
A teaspoon can approximately hold 5 mL.
Although the capacity of a teaspoon could be more or less, choice D remains the most correct answer as the other choices have amounts too much for a small teaspoon.
This question was extracted from the actual TEAS Exam. Ace your TEAS exam with the actual TEAS 7 questions, Start your journey with us today
Visit Naxlex, the Most Trusted TEAS TEST Platform With Guaranteed Pass of 90%.
Money back guarantee if you use our service and fail the actual exam. Option of personalised live tutor on your area of weakness.