How many feet are in 9 yards?
45 ft
18 ft
36 ft
27 ft
Correct Answer : D
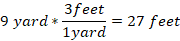
The interconversion of yards to feet utilizes the relationship 1 yard =3 feet. Then, 9 yards to ft becomes
 t
t
There, 9 yards is equal to 27 ft.
TEAS 7 Exam Quiz Bank
HESI A2 Exam Quiz Bank
Find More Questions 📚
Teas 7 Questions: We got the latest updated TEAS 7 questions
100% Money Refund: 100% money back guarantee if you take our full
assessment pass with 80% and fail the actual exam.
Live Tutoring: Fully customized live tutoring lessons.
Guaranteed A Grade: All students who use our services pass with 90%
guarantee.
Related Questions
Correct Answer is C
Explanation
We know that 1 L =1000 mL, which we use to convert between the two units. The conversion fractions of interconverting are:

And

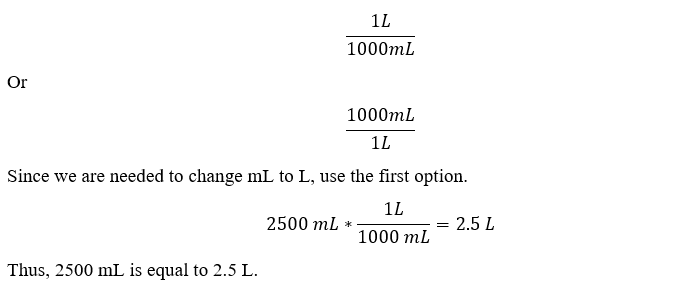
Since we want to end up with millimeters, the second conversion is used in converting L to mL as:
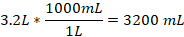
Thus, 3.2 L is equivalent to 3200 mL.
Correct Answer is B
Explanation
we are to find the selling price of the sweater from the marked price and the discount. The marked price is given as
Discount=mark off rate*original price
Discount=15%*$78
Convert 15% into a fraction, which become 15/100=0.15. Then
Discount=0.15*$78=$11.70
The selling price of the sweater will be the original price less the discount or mark off value. Then,

Thus, the approximate selling price of the sweater is $66.
Correct Answer is A
Explanation
The length of the unknown side of the rectangle can be found by using the Pythagoras theorem. Letting the unknown side to be x, the labelled rectangle becomes: The unknown length of the triangle is about 16.7 feet.
The length of the unknown side of the rectangle can be found by using the Pythagoras theorem. Letting the unknown side to be x, the labelled rectangle becomes: 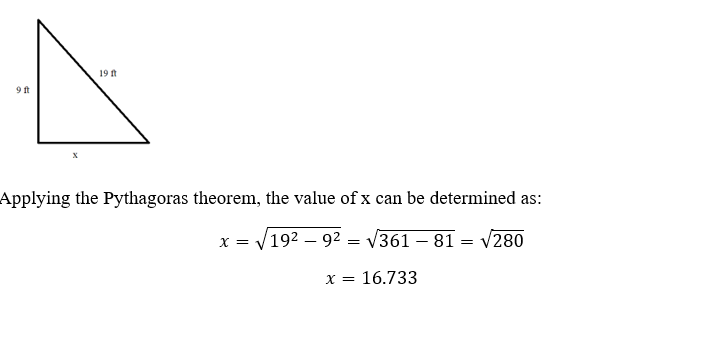
The unknown length of the triangle is about 16.7 feet.
Correct Answer is C
Explanation
Explanation: We know that 1 L=1000 mL and to change between L and mL we use the following two options

Correct Answer is D
Explanation
From the given estimations, we can find the exact sum after adding the given numbers and see the trend the student utilizes to find their estimates. The actual sum is as follows
26+180= 206
206
115+391= 506
506
497+2024= 2521
2521
From the above evaluation, the students round the exact sum to the nearest tens. So, in the problem we need to approximate 545+7501.
545+7501=8046
The exact sum is 8046 and the approximate value after rounding to the nearest tens is 8050.
Correct Answer is A
Explanation
we are asked to find the largest value from the options given. To solve this problem, we need to convert all the given values into fraction. Then find the least common denominator for all fractions, which we will use to multiply each fraction and make a comparison.
43÷ 55=43/55
5/7
0.729=729/1000
73%=73/100
Now, we need to find the least common denominator of 55, 7, 1000, and 100, which is 77000. We multiply each fraction by 77000 as follows:
43/55*77000=60200
5/7*77000=55000
729/1000*77000=56133
73/100*77000=56210
From the calculated values, it can be noted that 43/55 is the greatest value among the given options.
Correct Answer is B
Explanation
An independent variable is a variable that when changed result in a change to other variables under investigation. From the given scenario, if the stock of the company increases, then the production, sales, and investment increase. Therefore, stock is the independent variable while other variables are dependent.
Correct Answer is B
Explanation
Histograms are used to present frequency of data of one variable over the other. On the other hand, a bar graph is used to compare the two variables with the rectangles not touching one another as in histograms. Scatter plots are used to show the correlations between two variables. In this case, the teacher will be able to use scatter plot to establish the correlation between test scores and the subjects.
Correct Answer is D
Explanation
: we are needed to find the portion of burger the two other friends share between themselves. A whole burger is 1, and we know that,
One friend=1/4 of 1=1/4*1=1/4
Remaining amount=1-1/4=4/4-1/4=3/4
Thus, ¾ of burger is left for two friends to share among themselves. Then, each friend will get
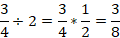
So, the other two friends will each get 3/8 of the burger.
Correct Answer is A
Explanation
: In order to solve for the value of x, we use the order of operations as follows:
The first step is to divide both sides by 3


Add 2 to both sides to eliminate it from the left-hand side of the equation
x-2+2=4+2
x = 6
Thus, the value of x is 6.
This question was extracted from the actual TEAS Exam. Ace your TEAS exam with the actual TEAS 7 questions, Start your journey with us today
Visit Naxlex, the Most Trusted TEAS TEST Platform With Guaranteed Pass of 90%.
Money back guarantee if you use our service and fail the actual exam. Option of personalised live tutor on your area of weakness.