How may milliliters are there in 0.5 liters?
500
50
5
5000
Correct Answer : A
We use 1 L =1000 mL to convert between the two units. The conversion fractions of interconverting are:

And

Since we want to end up with millimeters, the second conversion is used in converting L to mL as:
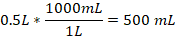
Thus, 0.5 L is equivalent to 500 mL.
TEAS 7 Exam Quiz Bank
HESI A2 Exam Quiz Bank
Find More Questions 📚
Teas 7 Questions: We got the latest updated TEAS 7 questions
100% Money Refund: 100% money back guarantee if you take our full
assessment pass with 80% and fail the actual exam.
Live Tutoring: Fully customized live tutoring lessons.
Guaranteed A Grade: All students who use our services pass with 90%
guarantee.
Related Questions
Correct Answer is D
Explanation
To form an equation from the word problem, first break the given statement into smaller statements.
First, we are given the width of the rectangle as x. We are told, the length is three times width. Mathematically, this means
Length=3*width=3*x=3x
Again, the length is 4 less than 3 times width of the rectangle. Thus, the length of rectangle in terms of width becomes:
Length =3x-4
This is the required equation.
Correct Answer is D
Explanation
Correlation of two variables falls into:
Positive correlation: an increase in one variable causes another variable to increase
Negative correlation: an increase in one variable causes another one to decrease
No correlation: a change in one variable does not cause any response in another variable.
From the given choices
Option a is no correlation
Option b is a negative correlation
Option c is a negative correlation
Option d is a positive correlation
Correct Answer is A
Explanation
we are needed to find the portion of pizza shared by 3 three friends. We treat the whole pizza as 1. Now, 1 friend eats half of the whole pizza. Thus,
One friend=1/2 of 1=1/2*1=1/2
Remaining amount=1-1/2=2/2-1/2=1/2
Thus, ½ of pizza is left for three friends to share among themselves. Then, each friend will get
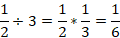
So, the other three friends will each get 1/6 of the pizza.
Correct Answer is B
Explanation
We need to find how many mL are in 2.5 teaspoons. We need to use dimensional analysis to solve this problem as follows.
Converting between teaspoon and mL uses the following conversions:

Or

We want to end up with mL, we utilize the second conversion and set up the following equation.
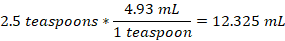
Thus, 2.5 teaspoons can hold 12.325 mL.
Correct Answer is A
Explanation
The initial step is to convert the decimal numbers into fractions.
4.4 becomes 44/10
4.25 becomes 425/100
Thus, the set of fractions is 9/2, 44/10, 10/3, 425/100. The least common denominator for 2, 10, 3, and 100 is 300, which we use to compare each options given.
9/2*300=1350
44/10*300=1320
10/3*300=1000
425/100*300=1275
From the above, 1350 is the greatest value which corresponds to 9/2. Thus, 9/2 is the greatest value of all the choices given.
Correct Answer is D
Explanation
: we are to find the selling price of the sweater after subtracting the mark off price.
Mark off value=mark off rate*original price
Mark of value=25%*$87
We convert 25% into a fraction, which become 25/100=0.25. Then
Mark of value=0.25*$87=$21.75
The selling price of the sweater will be the original price less the mark off value. Then,

Thus, the approximate selling price of the sweater is $65.
Correct Answer is C
Explanation
we need to find the net income of the nurse in 4 weeks from the weekly net income.
Weekly net income=gross income-total tax
Total tax=federal income tax+state income tax+Social Security tax
Total tax=$(83.00+38.00+79.00)
Total tax=$200.00
Weekly net income=$(800.00-200.00)=$600.00
In one week, the net income of the nurse is $600.00 and in 4 weeks the nurse will a net income of:
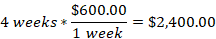
The nurse will earn $2,400.00 in 4 weeks after taxes are deducted.
Correct Answer is B
Explanation
Since the distribution is symmetric, the mean, mode, and median will all be equal. The shape of the distribution will be bell-shaped.
Correct Answer is A
Explanation
The initial step is to establish the relationship between area of a circle and the radius. The area of the circle is given by the formula

Now, substituting the 49 π in2 in place of A in the equation above becomes:

We want to find r, therefore, we rearrange the equation as

Divide both sides by 


Take square root both sides of the equation


The radius of the circle is 7 in, and the circumference of the circle is determined as follows
Substituting the value of r=7 becomes

Thus, the circumference of a circle whose area is 49  in2 is 14
Correct Answer is A
Explanation
We use 1 L =1000 mL to convert between the two units. The conversion fractions of interconverting are:
And
Since we want to end up with millimeters, the second conversion is used in converting L to mL as:
Thus, 0.5 L is equivalent to 500 mL.
This question was extracted from the actual TEAS Exam. Ace your TEAS exam with the actual TEAS 7 questions, Start your journey with us today
Visit Naxlex, the Most Trusted TEAS TEST Platform With Guaranteed Pass of 90%.
Money back guarantee if you use our service and fail the actual exam. Option of personalised live tutor on your area of weakness.