
2.50*0.25
Simplify the expression above. Which of the following is correct?
0.0625
6.025
0.625
6.25
Correct Answer : C
To solve this equation, we use a calculator and find the product as:
2.50*0.25=0.625
TEAS 7 Exam Quiz Bank
HESI A2 Exam Quiz Bank
Find More Questions 📚
Teas 7 Questions: We got the latest updated TEAS 7 questions
100% Money Refund: 100% money back guarantee if you take our full
assessment pass with 80% and fail the actual exam.
Live Tutoring: Fully customized live tutoring lessons.
Guaranteed A Grade: All students who use our services pass with 90%
guarantee.
Related Questions
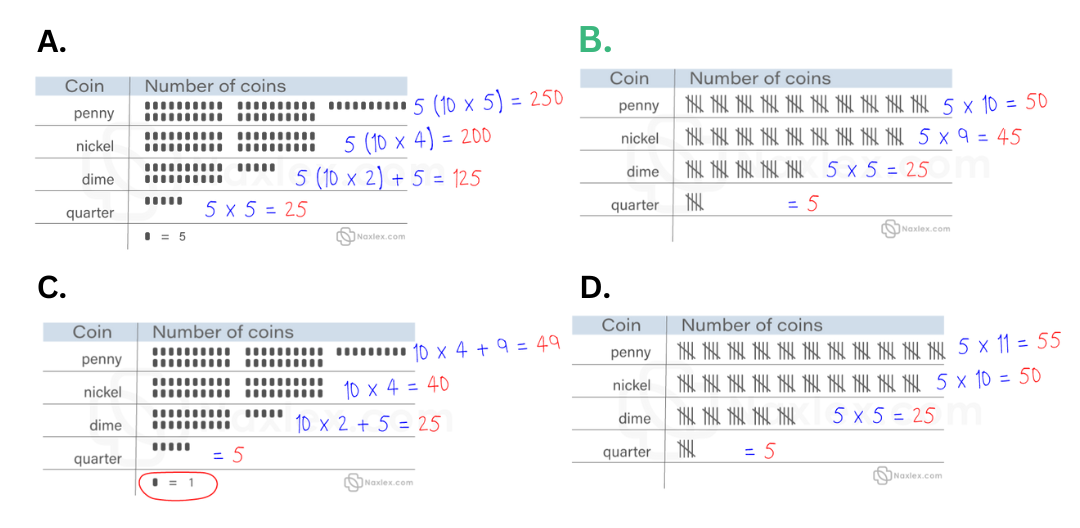
Correct Answer is B
Explanation
In this scenario, we use the given scale in the charts to find the number of each coin and selected the right number of coins the student collected. The second options shows that the child collected 50 pennies, 45 nickels, 25 dimes, and 5 quarters.
Correct Answer is C
Explanation
In this problem, we assume the truck carries a whole cargo. Thus, total weight is 516 lb divided by 1/3. Thus,

We change the division sign to product and multiply 516 by reciprocal of 1/3. Then,
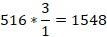
The weight of the cargo will be 1548 lbs.
Correct Answer is C
Explanation
to convert fraction to percent, we multiply the fraction with 100. Therefore, the percent equivalent of 5/8 is
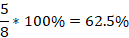
Thus, 5/8 is equal to 62.5%.
Correct Answer is A
Explanation
we are needed to find the amount Lana is left with after spending and investing the rest using the given information.
Amount Lana spends = 80% of $60= 80/100 *60 = $48
Amount left to invest = $(60-48) = $12
Lana is left with $12, which she invests and earns a profit of 80%.
Profit earned = 80% of $12 = 80/100 * 12= $9.20
So, Lana will have $12 + $9.20 = $21.60
Correct Answer is D
Explanation
we use given information to find how much ammonia is need to make the specified solution.
We are told, one gallon of cleaning solution requires 6 oz of ammonia. In other words, we can express this as:
1 gallon of solution6 oz of ammonia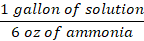
Or
6 oz of ammonia1 gallon of solution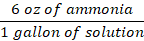
Since we are needed to find how much ammonia is needed, we use the second option to find how much ammonia is required by 120 gallons of solution.

From the above equation, gallon of solution will cancel, and oz of ammonia is left.
Therefore, the solution will require 720 oz of ammonia.
Correct Answer is D
Explanation
To form an equation from the word problem, first break the given statement into smaller statements.
First, we are given the width of the rectangle as x. We are told, the length is three times width. Mathematically, this means
Length=3*width=3*x=3x
Again, the length is 4 less than 3 times width of the rectangle. Thus, the length of rectangle in terms of width becomes:
Length =3x-4
This is the required equation.
Correct Answer is B
Explanation
We are told to find the area of the pizza given its diameter. The pizza is in circular form, and its area is found as:

However, we are not given r, which is the radius of the circle. But we can find it from the given diameter as
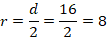
Substituting r=8 in the equation of the area of a circle

Thus, the area of the pizza is 64  in2.
in2.
NOTE:  (Pi) remains as a symbol because values of Pi can vary from 22/7 to 3.1415 to 3.14 and so forth.
Correct Answer is D
Explanation
we need to form a mathematical expression from the given word problem.
Let the number be x.
Twice a number=2x
Five less than twice a number=2x-5
So the mathematical express from the word problem is 2x-5
Correct Answer is B
Explanation
in the given problem, we use the calculator to find 1.3*0.47=0.611
Correct Answer is C
Explanation
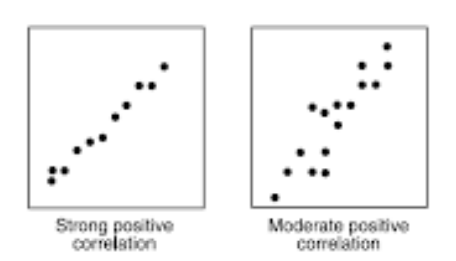
scatter plots can of three types: positive, negative and no correlation. A positive correlation scatter plot shows that as one variable increase, the other variable increases. A positive correlation can be visually depicted below.
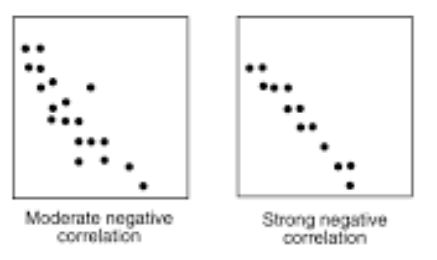
In a negative correlation, the change in one variable is inversely proportional to another variable. That is, as one variable increases, the other variable decreases as shown below.
The third type of scatter plot is a no-correlation scatter plot. In this type of plot, there is no defined relationship between one variable and another one as in the curve below.
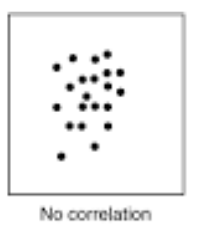
If we look at the relationship between the time the student listens to music and his test score, it is evident that no relationship exists between the two variables. Thus, this is a type of no correlation scatter plot.
This question was extracted from the actual TEAS Exam. Ace your TEAS exam with the actual TEAS 7 questions, Start your journey with us today
Visit Naxlex, the Most Trusted TEAS TEST Platform With Guaranteed Pass of 90%.
Money back guarantee if you use our service and fail the actual exam. Option of personalised live tutor on your area of weakness.