The data below represents students’ test scores. Which of the following is the median of the set data?
11, 12, 18, 14, 22, 17, 17, 12, 26, 12, 13
15
12
14
15.8
Correct Answer : C
the median of a data set is the element that is found on the middle position. It is found by organizing the elements from the smallest to largest.
The data set above arranged from the smallest to largest is:
11, 12, 12, 12, 13, 14, 17, 17, 18, 22, 26
The number of elements is odd and the median is found in the (N+1)/2 th position. Here N=11, and the median falls in (11+1)/2=12/2=6 th position.
The element 14 falls in the 6th position, which is our median of the given data set.
TEAS 7 Exam Quiz Bank
HESI A2 Exam Quiz Bank
Find More Questions 📚
Teas 7 Questions: We got the latest updated TEAS 7 questions
100% Money Refund: 100% money back guarantee if you take our full
assessment pass with 80% and fail the actual exam.
Live Tutoring: Fully customized live tutoring lessons.
Guaranteed A Grade: All students who use our services pass with 90%
guarantee.
Related Questions
Correct Answer is C
Explanation
to convert fraction to percent, we multiply the fraction with 100. Therefore, the percent equivalent of 5/8 is
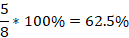
Thus, 5/8 is equal to 62.5%.
Correct Answer is A
Explanation
from the given estimations, we can find the actual addition of the numbers and see a trend the student utilizes to find their estimates. The exact sum is as follows
24+190=214
151+319=470
974+1022=1996
From the above evaluation, we can clearly see the students approximates the value in the ones values. So, in the problem we need to approximate 452+5017.
452+5017=5469
We can approximate 5469 based on the provided choices to 5470.
Correct Answer is B
Explanation
here we use the US customary system to convert between yards and feet. We use the conversion 1 yard =3 feet. Then, 6 yards to ft is found as
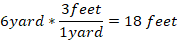
Thus, 6 yards is equal to 18 ft.
Correct Answer is B
Explanation
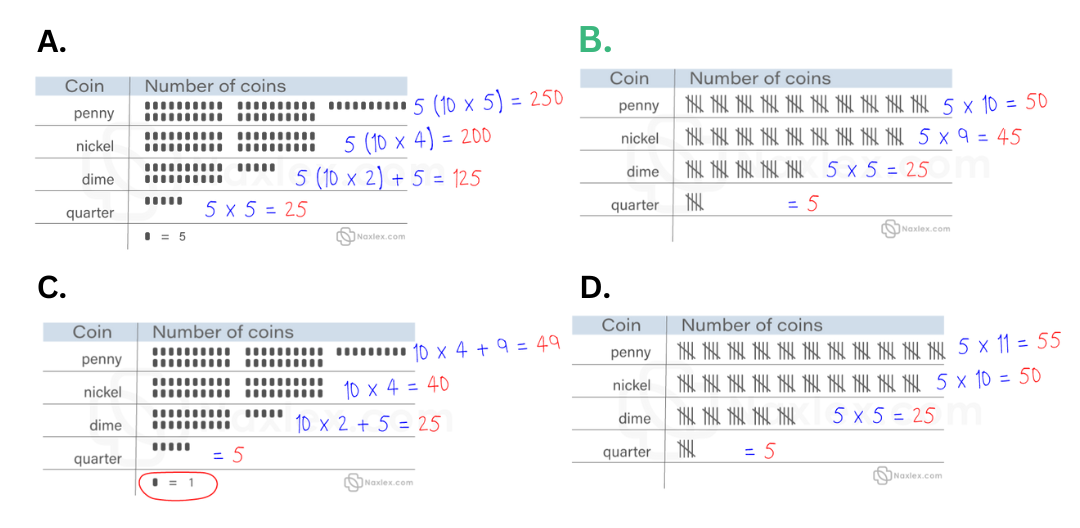
In this scenario, we use the given scale in the charts to find the number of each coin and selected the right number of coins the student collected. The second options shows that the child collected 50 pennies, 45 nickels, 25 dimes, and 5 quarters.
Correct Answer is C
Explanation
To simplify the expression:
12+3×4−1+23
Step 1: Follow the order of operations (BODMAS)
Multiplication first:
3×4=12
23 = 2×2×2=8
Now the expression becomes:
12+12−1+8
Step 2: Perform addition and subtraction from left to right
- 12+12=24
- 24−1=23
- 23+8=31
The correct answer is 31.
Correct Answer is D
Explanation
The best way to display the frequency of each day of the week when students get up after 8 a.m. is by using a bar graph. Bar graphs are well-suited for representing categorical data, where each day of the week is a separate category, and the height of each bar corresponds to the count or frequency of students waking up late on that specific day.
Note: Histograms, on the other hand, are more appropriate for visualizing continuous or numerical data and are not ideal for categorical data like days of the week.Histograms are useful for understanding the distribution of data, identifying patterns, and assessing the shape of the data distribution, such as whether it's normally distributed, skewed, or has multiple modes.
As you can see below, the Histogram is used to depict a pattern/continuous/rangedata. While a bar graph does just fine even with discrete data.


Correct Answer is A
Explanation
To find the least common denominator (LCD) of the fractions 1/2, 2/3, and 4/5, follow these steps:
Step 1: Identify the denominators
The denominators are 2, 3, and 5.
Step 2: Find the least common multiple (LCM)
The LCM of 2, 3, and 5 is the smallest number that all three denominators divide into evenly.
- Prime factorization:
- 2=2
- 3=3
- 5=5
Since 2, 3, and 5 are all prime numbers, their LCM is:
2×3×5=30
Correct Answer is A
Explanation
we are needed to find the amount Lana is left with after spending and investing the rest using the given information.
Amount Lana spends = 80% of $60= 80/100 *60 = $48
Amount left to invest = $(60-48) = $12
Lana is left with $12, which she invests and earns a profit of 80%.
Profit earned = 80% of $12 = 80/100 * 12= $9.20
So, Lana will have $12 + $9.20 = $21.60
Correct Answer is B
Explanation
When dealing with percent problems, the following is utilized to find the unknown variable.
- Is means equals
- Of means multiply
- What means unknown (variable)
From the problem above, we are looking for the amount of gratuity the couple can leave.
Let t be the amount of gratuity. Translating into an equation, we have
The gratuity is 15% of the total bill, which becomes
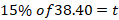
Here, of means multiply and we also convert percent into decimal before multiplying.
So, the value of t=5.76
Thus, a couple will leave a gratuity of $5.76, which is about $6.00.
Correct Answer is C
Explanation
In this problem, we assume the truck carries a whole cargo. Thus, total weight is 516 lb divided by 1/3. Thus,

We change the division sign to product and multiply 516 by reciprocal of 1/3. Then,
The weight of the cargo will be 1548 lbs.
This question was extracted from the actual TEAS Exam. Ace your TEAS exam with the actual TEAS 7 questions, Start your journey with us today
Visit Naxlex, the Most Trusted TEAS TEST Platform With Guaranteed Pass of 90%.
Money back guarantee if you use our service and fail the actual exam. Option of personalised live tutor on your area of weakness.