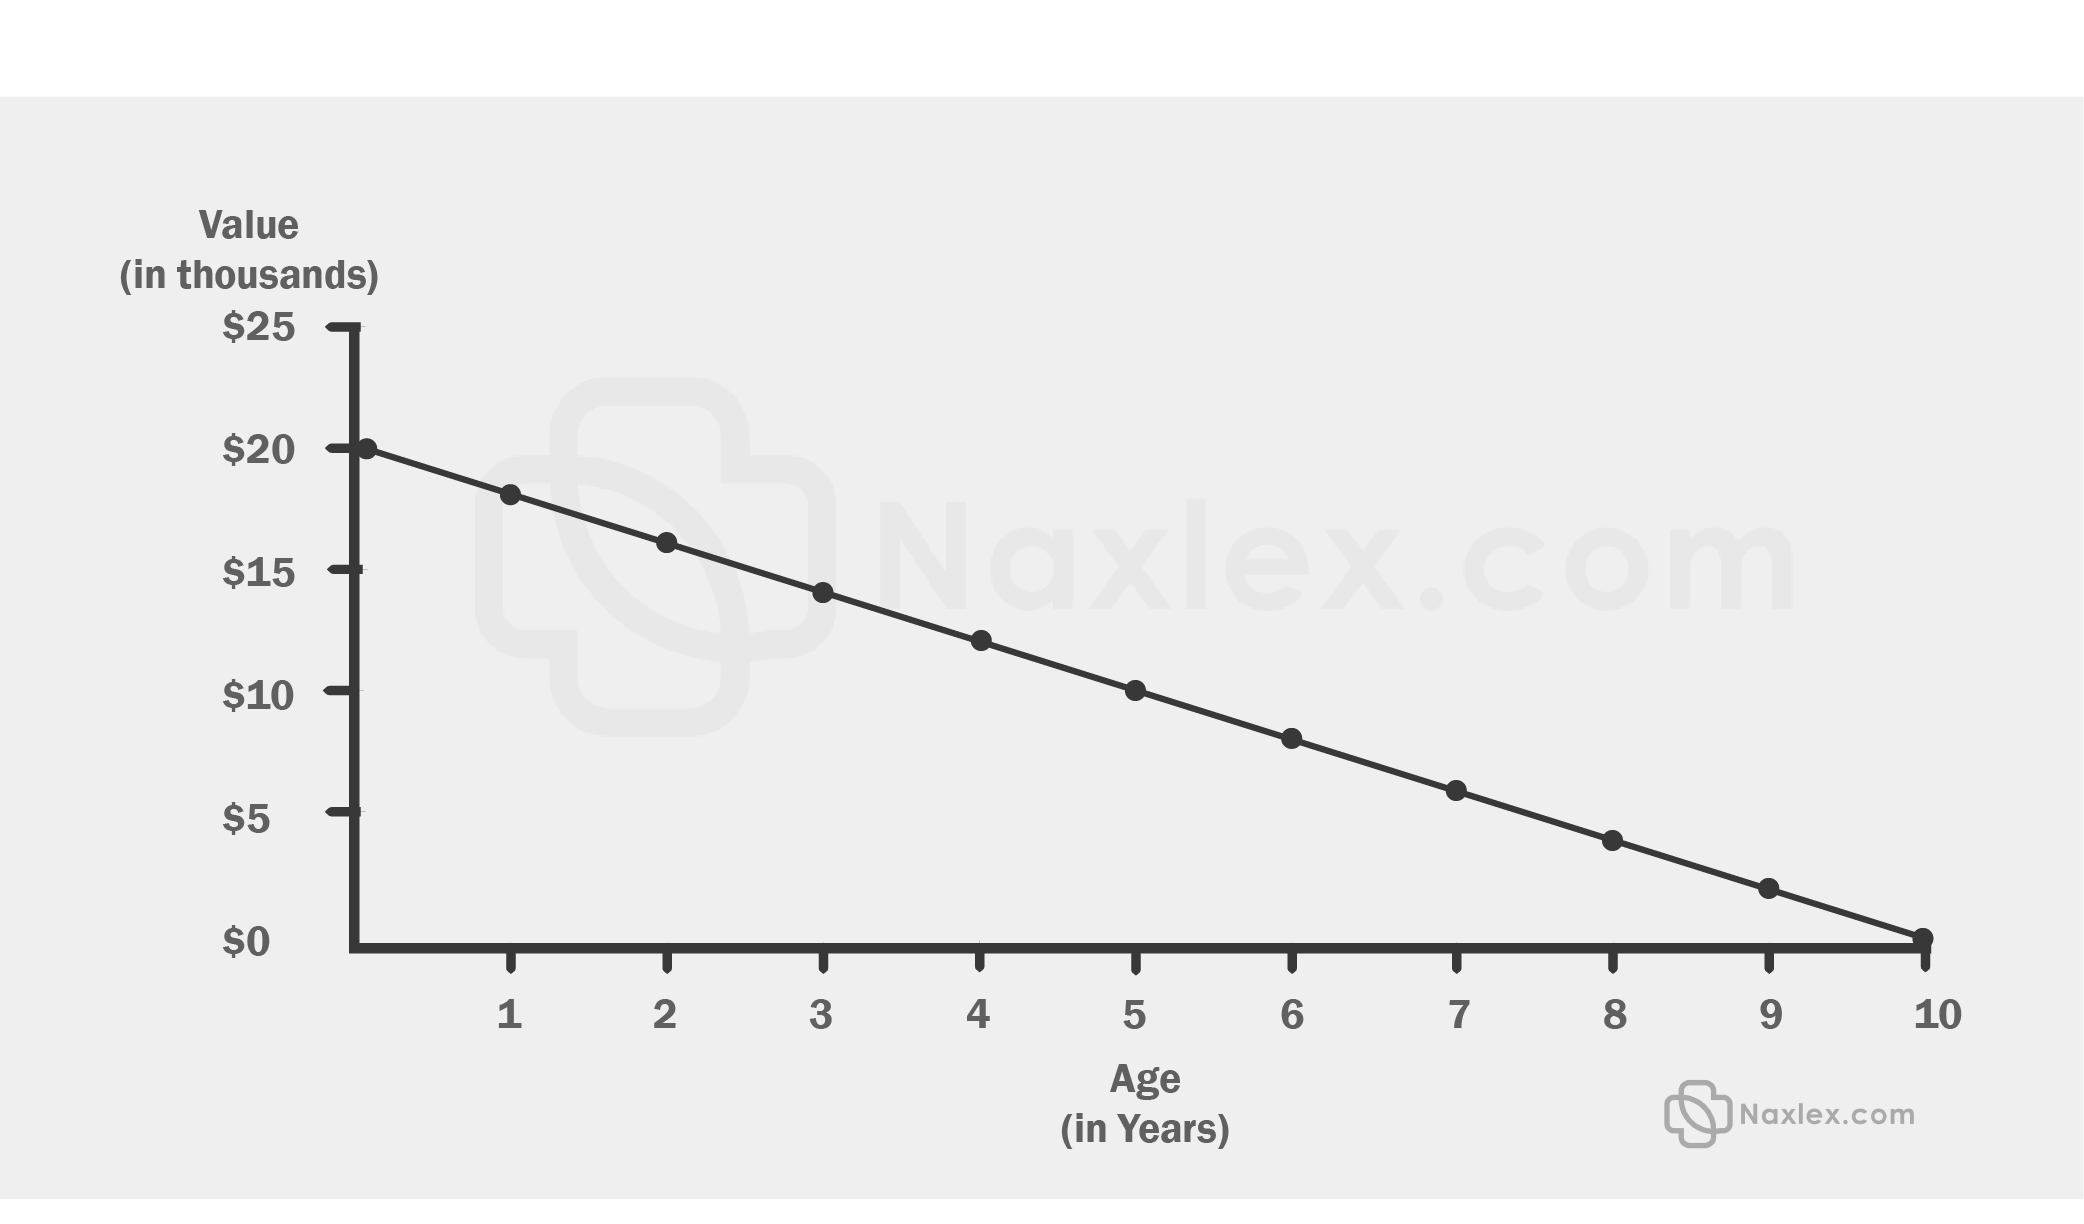
The graph below compares the age of car to its value. Which of the following is the age of the car when its value is $12,500?
Between 2 and 3 years
Less than 1 year
Greater than 3 years
Between 1 and 2 years
Correct Answer : C
We extrapolate the values of a line between 10 and 15 on y-axis to meet the curve and drop another line from the intersection of the curve to meet the x-axis and read off the age of the car.
Now, let’s extrapolate in the following diagram
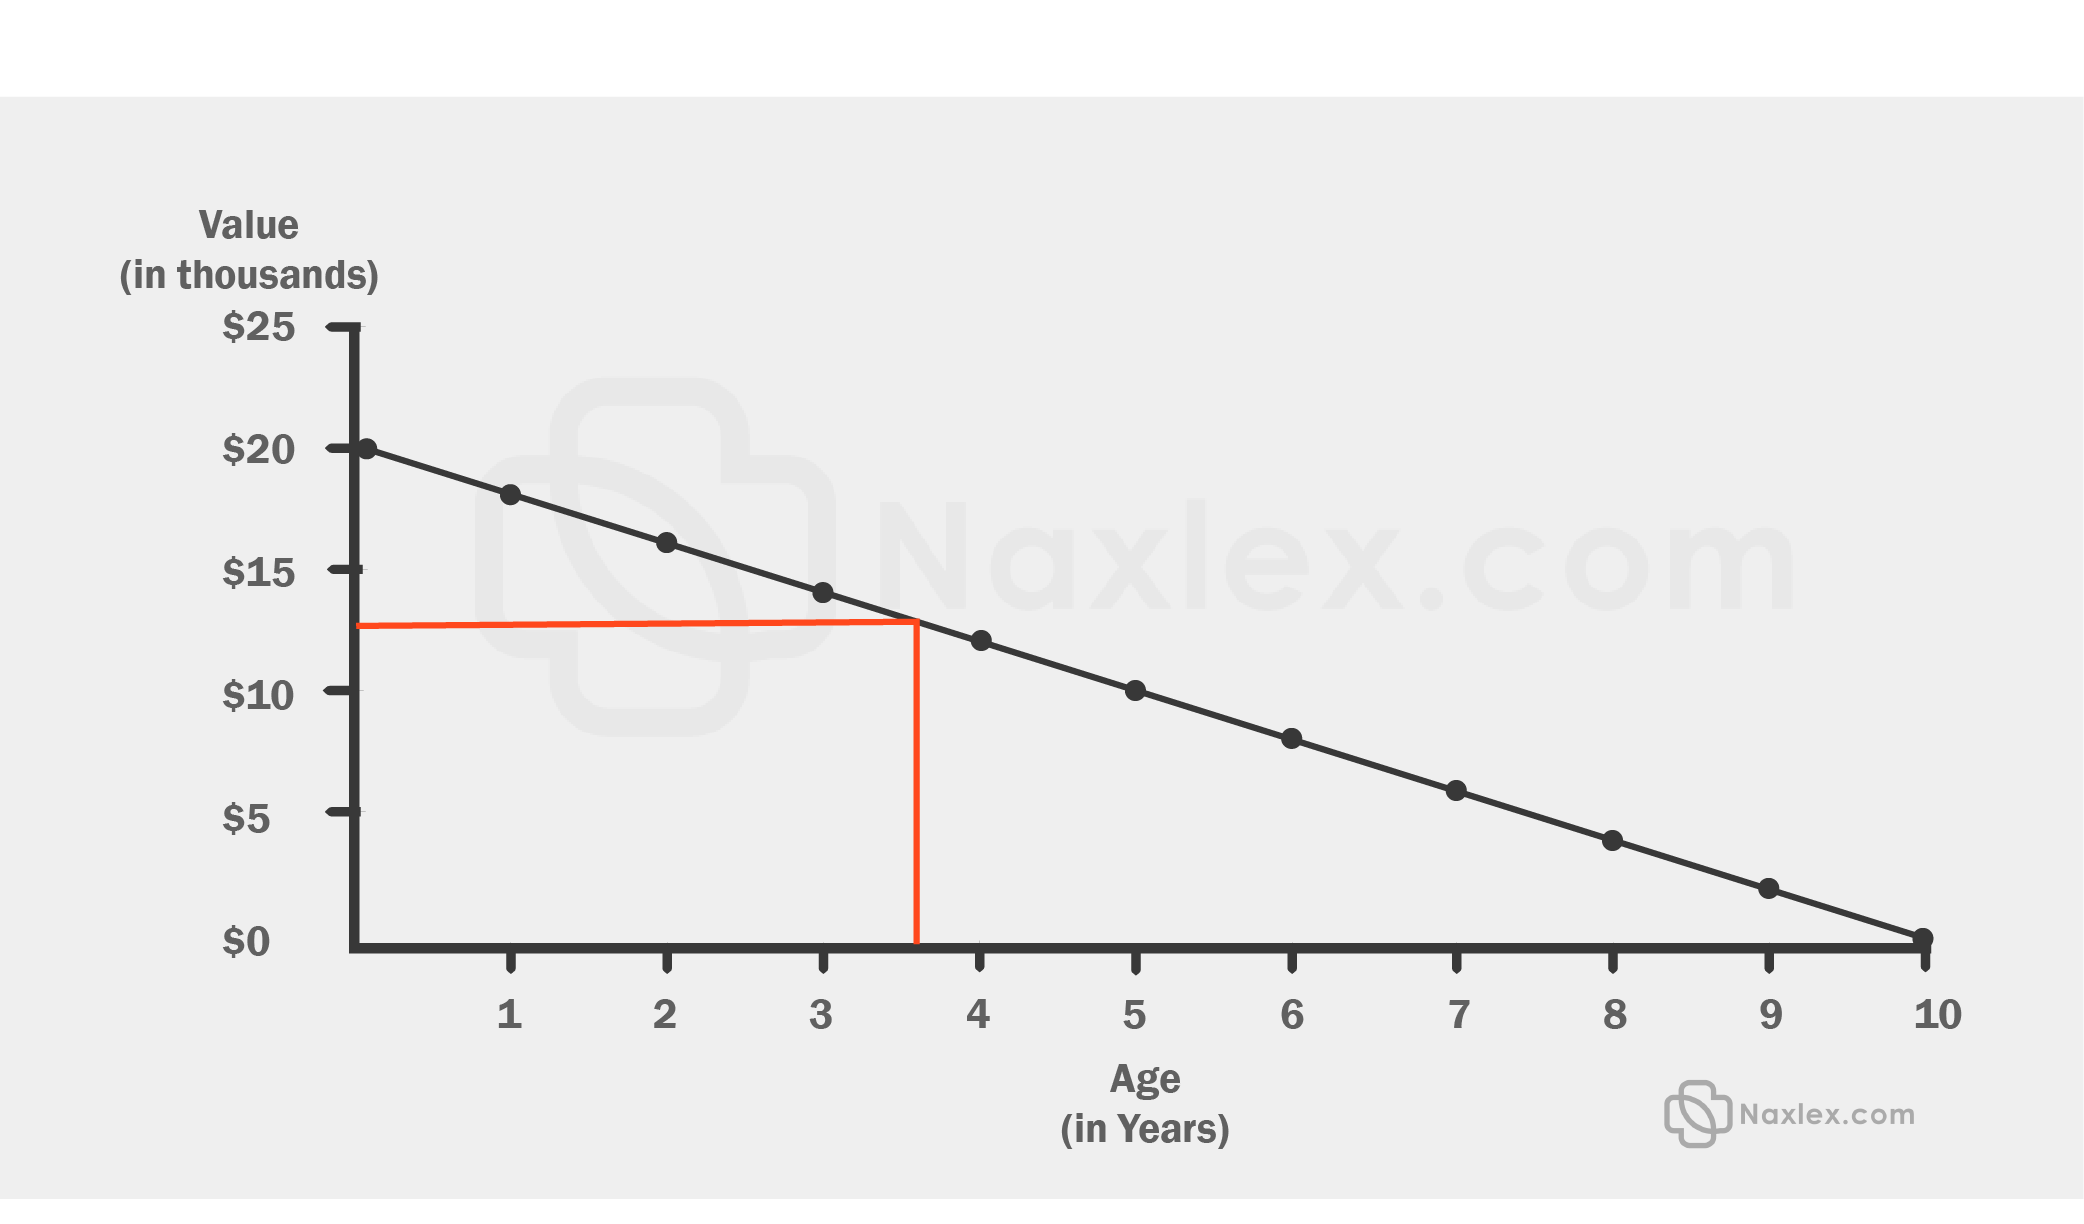
The intersection of the line and the x-axis is between 4 and 5 years. This means that the car is about 4.5 years old. From the options given, the age of the car is more than 3 years old.
TEAS 7 Exam Quiz Bank
HESI A2 Exam Quiz Bank
Find More Questions 📚
Teas 7 Questions: We got the latest updated TEAS 7 questions
100% Money Refund: 100% money back guarantee if you take our full
assessment pass with 80% and fail the actual exam.
Live Tutoring: Fully customized live tutoring lessons.
Guaranteed A Grade: All students who use our services pass with 90%
guarantee.
Related Questions
Correct Answer is B
Explanation
The median temperature can be found by organizing the temperature values from the smallest to the largest value as follows:
98.6, 98.7, 99.0, 99.0,99.2, 99.3, 99.7, 100.0
(for an even set of numbers, Median = frac{(frac{n}{2})th observation + (frac{n}{2} + 1) th observation}{2})
From the data set above, there are 8temperature values. The median is the temperature value in the middle position, which falls between the(frac{n}{2} th)and((frac{n}{2} + 1) th) position. Here N=8and median is found as:
(frac{(frac{n}{2})th + (frac{n}{2} + 1) th}{2} = )(frac{(frac{8}{2})th + (frac{8}{2} + 1) th }{2} = 4.5th position)
The element in the 4.5th position is the average of the 4th and 5th element.
(frac{99.0 + 99.2}{2} = 99.1)
Thus 99.1 is the median temperature.
Correct Answer is A
Explanation
Here we collect like terms together and solve for the unknown value of x.
7x-6=3x-26
Add 6 to both sides of the equation
7x-6+6=3x-26+6
7x=3x-20
Subtract 3x from both sides of the equation
7x-3x=-20
4x=-20
Divide both sides by 4
4x/-4=-20/4
x = -5
The value of x = -5
Correct Answer is B
Explanation
Here we are required to find the area of the square of sides 3.1 m. The square is a four-sided figure with each side equal and opposite sides making 90 degrees.
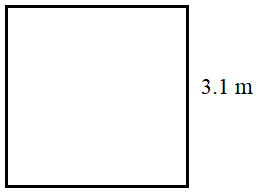
Area of the square =side*side
Side=3.1 m
Area of the square =3.1 m *3.1 m=9.61 m2
Note: 3.1 + 3.1 = 6.2 which is a wrong answer.
Correct Answer is C
Explanation
We extrapolate the values of a line between 10 and 15 on y-axis to meet the curve and drop another line from the intersection of the curve to meet the x-axis and read off the age of the car.
Now, let’s extrapolate in the following diagram
The intersection of the line and the x-axis is between 4 and 5 years. This means that the car is about 4.5 years old. From the options given, the age of the car is more than 3 years old.
Correct Answer is A
Explanation
To find the net force, we choose east direction as positive and west as negative. From this, we can present the tag of war in the diagram below.
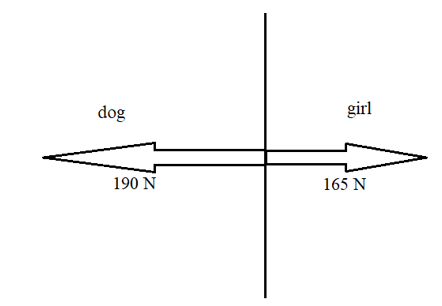
So, the force on the dog is -190 N and that of the girl is 165 N.
The net force is the sum of the two forces

The resulting force is negative, meaning it is in the west direction. Thus, the net force is 25 N to the west.
Correct Answer is C
Explanation
When dividing fractions, the division sign is changed into multiply sign and the first fraction is multiplied by the inverse of the second fraction.

Change division to multiply sign and find invers of 5/8. The inverse of a fraction is inverting the given fraction. The denominator becomes the numerator and the numerator becomes the denominator.

Correct Answer is D
Explanation
We solve the problem by first finding the amount of gallons needed for the whole trip then find the cost of the gallon.
The car uses 1 gallon to cover 25 miles, which is same as:

Now, in 3000 miles, the car will use how many gallons of gasoline?
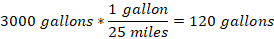
A trip of 3000 miles will need 120 gallons. And to find the cost of 120 gallons, we proceed as follows:
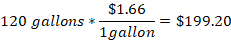
The family will spend $199.20 to drive for 3000 miles.
Correct Answer is D
Explanation
The mean is the total divided by the number of elements in the data set. From the given data set:
Total=30+29+28+30+24+12+26+33+25+23=260
Number of items, N=10
Mean=total/N=260/10=26
The mean is 26.
Correct Answer is B
Explanation
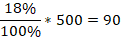
The whole pie chart represents 100%, which we use together with the given percentages to find the respective different sports. Note that 100% is equal to 500 surveyed students. The, the number of teenagers who prefer:
Soccer
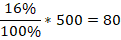
Hockey
Football
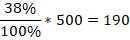
Basketball
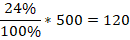
Other
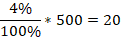
From the evaluations above, 90 teenagers love soccer, 80 love hockey, 190 teenagers love football, 120 teenagers love basketball, and 20 teenagers love others.
Correct Answer is B
Explanation
from the provided table, the first option represents the amount of gas in gallons while the second column shows the distance in miles. Thus, (6, 144) will denote that the car can 144 miles by consuming 6 gallons of a gas.
This question was extracted from the actual TEAS Exam. Ace your TEAS exam with the actual TEAS 7 questions, Start your journey with us today
Visit Naxlex, the Most Trusted TEAS TEST Platform With Guaranteed Pass of 90%.
Money back guarantee if you use our service and fail the actual exam. Option of personalised live tutor on your area of weakness.