Which of the following is 31% of 426?
425.69
132.06
13.7
0.07
Correct Answer : B
First convert 31% to a decimal before working on the problem
31%=31/100=0.31
Thus, 31% of 426=0.31*426=132.06
TEAS 7 Exam Quiz Bank
HESI A2 Exam Quiz Bank
Find More Questions 📚
Teas 7 Questions: We got the latest updated TEAS 7 questions
100% Money Refund: 100% money back guarantee if you take our full
assessment pass with 80% and fail the actual exam.
Live Tutoring: Fully customized live tutoring lessons.
Guaranteed A Grade: All students who use our services pass with 90%
guarantee.
Related Questions
Correct Answer is A
Explanation
To find a solution to this, we need to find the change in spending between the year 2013 and 2015 for each country. Change is difference in amount spent in 2015 and 2013 for each country:
Sudan=$(24-17)= $7
Eritrea=$(42-56)= - $14
Nigeria = $(21-16)= $5
Tanzania =$(81-68) = $13
Rwanda = $(24-27) =-$3
Kenya = $(88-81) = $8
A Minus sign means a decrease in spending. From the above calculations, Eritrea had the GREATEST change in dollars spent while Rwanda had the LEAST change in dollars spent.
Correct Answer is D
Explanation
The most likely weight of pencil is 25 g, because a pencil is a lighter object which is measured in grams.
Correct Answer is B
Explanation
We use the relation 1 kg=1000 g to convert 3.193 kg to g

Correct Answer is B
Explanation
100% represents total students four allied health program. Thus, 100%=800 students, and 19% joins respiratory care program is

Thus, 152 students joined the respiratory care program.
Correct Answer is C
Explanation
To solve this problem, we need to find the mean, mode, and median of the above data set.
From the data set, the mode of the data is 2 and 8. They are the most occurring elements in the data set.
The mean of data is the total divided by the number of elements
Total=1+ 1 + 2+ 2+ 2+ 2+ 3 +3+ 7+ 7+8+8+ 8+ 8+ 9+9=80
Number of elements=16
Mean=80/16=5
Median will fall in between the (N/2)th and (N/2+1)th position
(N/2)th =16/2 =8th position and (16/2+1)th =9th position
Since the data is arranged in ascending order as below
1, 1, 2, 2, 2, 2, 3, 3, 7, 7, 8, 8, 8, 8, 9, 9
Element in 8th position = 3
Element in 9th position =7
So the median average of the two elements=(3+7)/2=5
Now the data could be presented as follows in the distribution curve
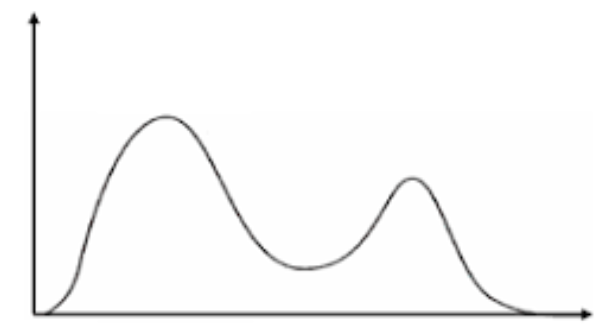
This is because the data set has two modes, meaning the data is bimodal.
Correct Answer is B
Explanation
Number of boxes in the room is equal to the volume of the room divided by the volume of one box
Volume of the room=9 ft*9 ft*9 ft= 729 ft3
Volume of one box = 2 ft* 2 ft * 2 ft= 8 ft3
Number of boxes= 729 ft3/ 8 ft3= 91.125 boxes
Thus, the room can store 91.125 boxes, which is about 91 boxes.
However, the room’s dimensions are 9 ft x 9 ft x 9 ft, and the boxes are 2 ft x 2 ft x 2 ft. To determine how many boxes fit along each dimension:
- In the 9 ft length, you can fit\(\frac{9}{2} = 4.5\) boxes, which means only 4 whole boxes fit along this dimension.
- In the 9 ft width, you can fit 4 whole boxes.
- In the 9 ft height, you can fit 4 whole boxes.
Therefore, the total number of boxes that fit is:
\(4×4×4=64\ boxes\)
Correct Answer is C
Explanation
In a negatively-correlated variables, a change in one variable result in opposite change in the other variable. In other words, an increase in on variable results in a decrease in the other.
Now let’s analyze the given scenarios:
As elevation decreases, temperature remains the same this is NO-CORRELATION
As elevation decreases, temperature decreases is a POSITIVE CORRELATION
As elevation increases, temperature decreases is a NEGATIVE CORRELATION
As elevation increases, temperature increases is a POSITIVE CORRELATION
Correct Answer is A
Explanation
Yoghurt: toppings=4:3
Yoghurt: 4.5 oz =4:3
We convert the given ratio into a proportion equation as below

Multiply both sides by 4.5 oz

Correct Answer is C
Explanation
The constant of proportionality is the distance traveled divided by gallons of gas consumed
Constant of proportionality = 386.4 miles/14 gallons = 27.6 miles per gallon.
Correct Answer is C
Explanation
Given:
- Original price of the recliner: P
- Sale price (30% less than the original price): 0.7P
- Coupon saves an additional 25% off the sale price: 0.75 *0.7P = 0.525P
- The consumer pays $237 for the recliner.
We set up the equation:
0.525P = 237
Now, let's solve for P:
P = 237 / 0.525}
P = 451.428
Rounded to the nearest dollar, the original price of the recliner is approximately 451dollars.
This question was extracted from the actual TEAS Exam. Ace your TEAS exam with the actual TEAS 7 questions, Start your journey with us today
Visit Naxlex, the Most Trusted TEAS TEST Platform With Guaranteed Pass of 90%.
Money back guarantee if you use our service and fail the actual exam. Option of personalised live tutor on your area of weakness.