Which of the following is the correct conversion of 2 3/4 yards into inches?
33 inches
11 inches
75 inches
99 inches
Correct Answer : D
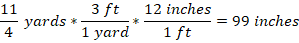
we use the US customary system of units’ equivalent to convert from yards to inches. We know that 1yard=3 ft, and 1 ft =12 inches.
First, convert 2 ¾ into an improper fraction.
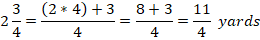
Then,
TEAS 7 Exam Quiz Bank
HESI A2 Exam Quiz Bank
Find More Questions 📚
Teas 7 Questions: We got the latest updated TEAS 7 questions
100% Money Refund: 100% money back guarantee if you take our full
assessment pass with 80% and fail the actual exam.
Live Tutoring: Fully customized live tutoring lessons.
Guaranteed A Grade: All students who use our services pass with 90%
guarantee.
Related Questions
Correct Answer is D
Explanation
A teaspoon can approximately hold 5 mL.
Although the capacity of a teaspoon could be more or less, choice D remains the most correct answer as the other choices have amounts too much for a small teaspoon.
Correct Answer is D
Explanation
we use the US customary system of units’ equivalent to convert from yards to inches. We know that 1yard=3 ft, and 1 ft =12 inches.
First, convert 2 ¾ into an improper fraction.
Then,
Correct Answer is A
Explanation
Let xxx be the amount the friend paid for their car. The problem states:
48,000=2x−2,000
Step 1: Solve for x
Add 2,000 to both sides:
48,000+2,000=2x
Divide by 2:
x=25,000
Correct Answer is A
Explanation
We are given that 1 teaspoon=4.93 mL, we can interpret it as:

Or

Since we are to find the amount in mL, we look for an option that will cancel teaspoon and remain with mL. The second option is the required conversion, and we proceed as follows:
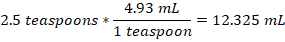
Therefore, 2.5 teaspoons hold about 12.325 mL.
Correct Answer is C
Explanation
We extrapolate the values of a line between 10 and 15 on y-axis to meet the curve and drop another line from the intersection of the curve to meet the x-axis and read off the age of the car.
Now, let’s extrapolate in the following diagram
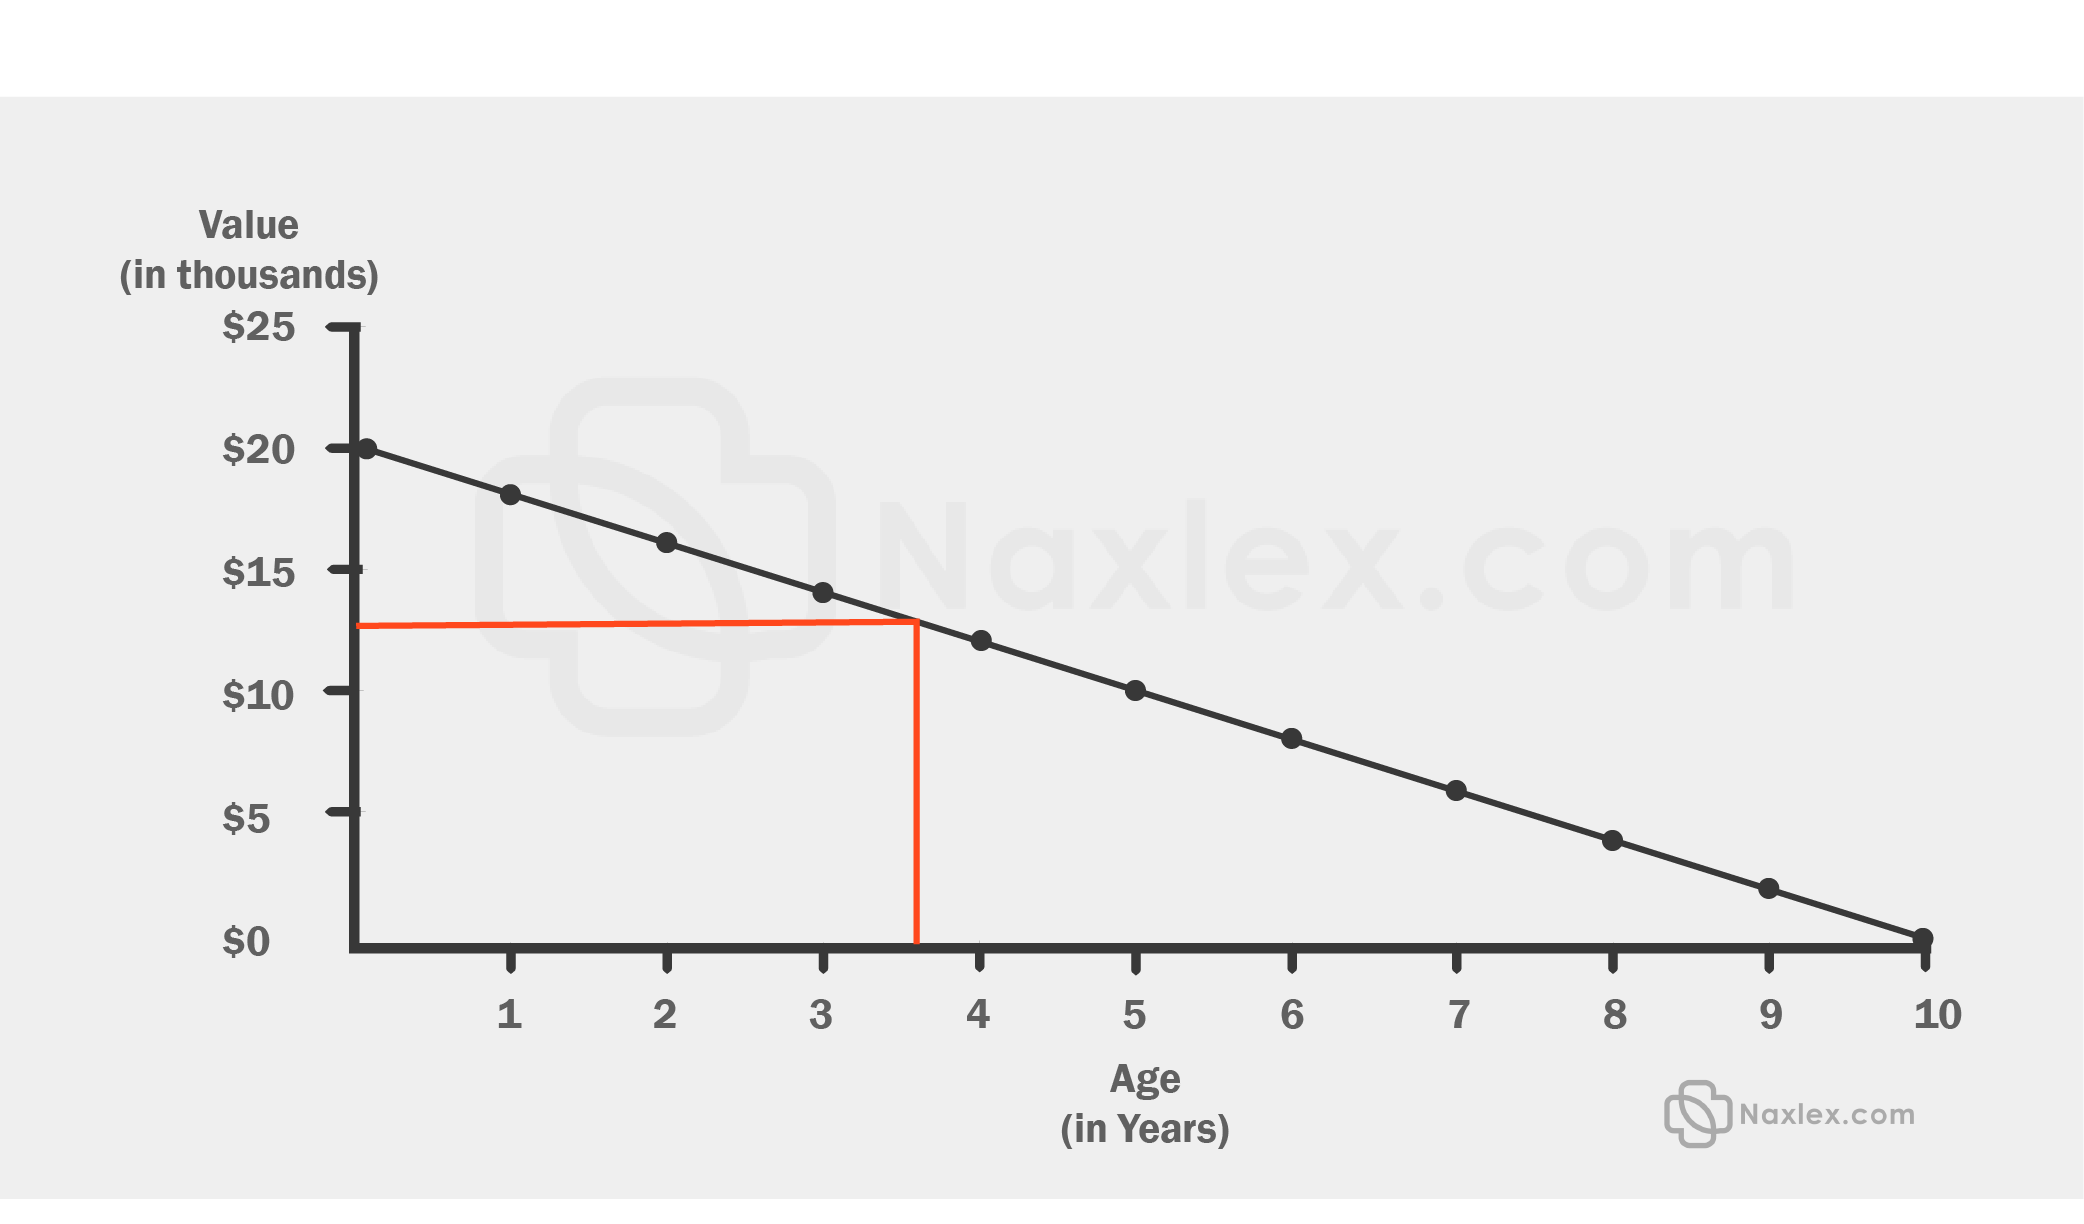
The intersection of the line and the x-axis is between 4 and 5 years. This means that the car is about 4.5 years old. From the options given, the age of the car is more than 3 years old.
Correct Answer is D
Explanation
To answer this question, we need to observe the trend of the number of days with dollars. On day 2, the dollars were 8, after 5 days, the dollars decreased to 3, after 13 days, the dollars increased to 10. After 14 days, the dollars declined to 6 and again rose to 16 dollars after 19 days.
From this observation, we cannot be able to establishany correlation between days and dollars.
Correct Answer is B
Explanation
From the given scenario:
Initial charge is $40
Additional charge per circular cloth=$5c
Additional charge per rectangular cloth=$3.50r
Total cost = additional charge per circular rectangular cloths + Initial charge
Total cost, T = 5c + 3.5r + 40
Correct Answer is C
Explanation
In this problem, to find one side of the square garden, we use the calculator to find the square root of 13. Thus
Thus, the approximate side of a square garden is about 3.6 ft
Correct Answer is D
Explanation
Round trip means to and from, which is twice the distance from home to a medical facility.
In one day, the round trip=19+19=38 miles
So, in 22 days, the round trip=38*22=836 miles.
The patient will cover 836 miles in 22 days.
Correct Answer is C
Explanation
When dividing fractions, the division sign is changed into multiply sign and the first fraction is multiplied by the inverse of the second fraction.

Change division to multiply sign and find invers of 5/8. The inverse of a fraction is inverting the given fraction. The denominator becomes the numerator and the numerator becomes the denominator.

This question was extracted from the actual TEAS Exam. Ace your TEAS exam with the actual TEAS 7 questions, Start your journey with us today
Visit Naxlex, the Most Trusted TEAS TEST Platform With Guaranteed Pass of 90%.
Money back guarantee if you use our service and fail the actual exam. Option of personalised live tutor on your area of weakness.