Which of the following is the mean of the test scores listed below?
83, 86, 76, 88, 97
97
76
86
83
Correct Answer : C
The mean of a data set is the sum of all scores divided by the number of tests.
Total test scores = 83+86+76+88+97 = 430
Number of tests = 5
Mean test score = 430/5 = 86
The mean test score is 86.
TEAS 7 Exam Quiz Bank
HESI A2 Exam Quiz Bank
Find More Questions 📚
Teas 7 Questions: We got the latest updated TEAS 7 questions
100% Money Refund: 100% money back guarantee if you take our full
assessment pass with 80% and fail the actual exam.
Live Tutoring: Fully customized live tutoring lessons.
Guaranteed A Grade: All students who use our services pass with 90%
guarantee.
Related Questions
Correct Answer is D
Explanation
Percentages are fractions with denominator equal to 100. To convert a percent to decimal form, divide the value by 100.
The decimal form of 98.2% is 0.982.
Correct Answer is B
Explanation
The volume V of a rectangular box can be calculated using the formula:
V=length×width×height
Given:
- Length = 8 metres
- Width = 5 metres
- Height = 3 metres
Now, calculate the volume:
V=8 m×5 m×3 m=120 m3
Thus, the volume of the box is 120 cubic metres.
The correct answer is B. 120 m³.
Correct Answer is B
Explanation
The number of boxes is determined by volume of the room divided by volume of one box.
Number of boxes

Therefore, about 24 boxes can be stacked in the room.
Correct Answer is D
Explanation
The probability of finding a green ball is given by
Total number of balls in the bag=6+8+3=17 balls
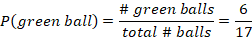
Therefore, the probability of drawing a green ball from the bag containing 17 balls is 6/17.
Correct Answer is B
Explanation
Based on the given scenario, the outcome of measuring the daily dollar rate is the decline in investment, stock prices, and forex exchange. The three outcomes are dependent variables while the dollar rate is the independent variable.
Correct Answer is A
Explanation
Given the equation A(f)=92+2f
To find the value of A(f), we need to manipulate the value of f. In this case, f is the independent variable while A(f) is the dependent variable.
Correct Answer is D
Explanation
To find the greatest number from the given options, convert the decimal numbers into fractions.
6.98 becomes 698/100
9.2 becomes 92/10
The least common denominator for the denominators of 7, 100 and 10 is 700. Now we can multiply each fraction with 700 as follows:
3/7*700=300
698/100*700=4886
10/7*700=1000
92/10*700=6440
In order from the smallest to largest, we organize the number set as follows:
3/7, 10/7, 6.98, 9.2.
Thus, 9.2 is the greatest of all.
Correct Answer is D
Explanation
We use the given slope to find the minimum length of the ramp. In this case, slope is the ratio of height to length of the lamp. Thus,
If we let x be the minimum length of the ramp. Then,
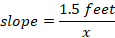
Substituting the value of slope into the above equation results in,

Solve for value of x by cross-products
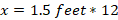
X = 18 Feet
Thus, the minimum length of the ramp needed to provide access to a door that is 1.5 high is 18 feet.
Correct Answer is D
Explanation
To find the amount of vanilla in mL, use dimensional analysis of the units of measurements.
Two ways to convert between teaspoon and mL are:


Since we are required to find the amount in mL, we use a cionverstioon that will result in mL. Inspecting the above options, we use the second option and set up an equation in way the unwanted units cancel out and leave the wanted unit we are looking for. Then,
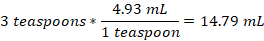
Thus, a recipe of 3 teaspoons equals 14.79 mL.
Correct Answer is B
Explanation
We are asked to determine Japheth’s uncle’s age relating to Japheth’s age.
First, express Japheth’s uncle’s age in terms of Japheth’s age as follows
Japheth’s age=k
Japheth’s uncle’s age, u = 3k-10.
Thus, the relationship between Japheth’s uncle’s age to that of Japheth is u=3k-10.
This question was extracted from the actual TEAS Exam. Ace your TEAS exam with the actual TEAS 7 questions, Start your journey with us today
Visit Naxlex, the Most Trusted TEAS TEST Platform With Guaranteed Pass of 90%.
Money back guarantee if you use our service and fail the actual exam. Option of personalised live tutor on your area of weakness.