Which of the following is the mostly likely weight of a pencil?
25 kg
25 cm
25 mg
25 g
Correct Answer : D
The most likely weight of pencil is 25 g, because a pencil is a lighter object which is measured in grams.
TEAS 7 Exam Quiz Bank
HESI A2 Exam Quiz Bank
Find More Questions 📚
Teas 7 Questions: We got the latest updated TEAS 7 questions
100% Money Refund: 100% money back guarantee if you take our full
assessment pass with 80% and fail the actual exam.
Live Tutoring: Fully customized live tutoring lessons.
Guaranteed A Grade: All students who use our services pass with 90%
guarantee.
Related Questions
Correct Answer is B
Explanation
Change in weight of client=new -old=1072-841= 231
Percent change=change/old*100%=231/841*100%=27.47%
The percentage change increase is about 27%
Correct Answer is B
Explanation
To convert inches to centimeters, use the conversion factor:
1inch=2.54cm
Now, multiply:
7×2.54=17.78cm
Correct Answer is C
Explanation
In a negatively-correlated variables, a change in one variable result in opposite change in the other variable. In other words, an increase in on variable results in a decrease in the other.
Now let’s analyze the given scenarios:
As elevation decreases, temperature remains the same this is NO-CORRELATION
As elevation decreases, temperature decreases is a POSITIVE CORRELATION
As elevation increases, temperature decreases is a NEGATIVE CORRELATION
As elevation increases, temperature increases is a POSITIVE CORRELATION
Correct Answer is A
Explanation
Hire purchase cost=down payment + total monthly installment
Total monthly payment=hire purchase cost-down payment= $(1570-400)=$ 1170
Number of months=total monthly payment/monthly payment=$1170/$100=11.7 months
The consumer will clear the balance in 12 months.
Correct Answer is C
Explanation
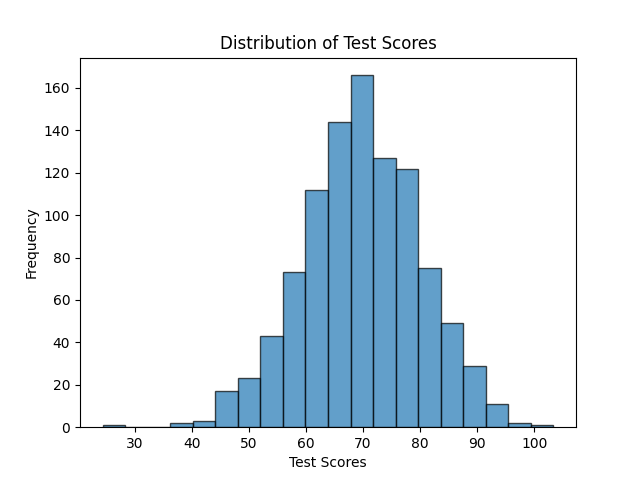
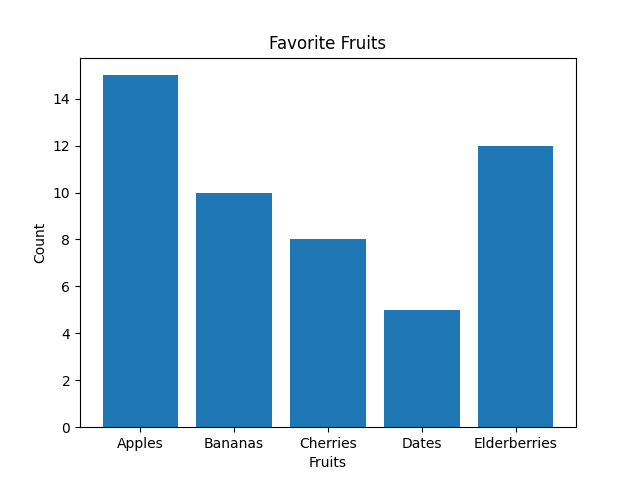
The best way to display the frequency of each day of the week when students get up after 8 a.m. is by using a bar graph. Bar graphs are well-suited for representing categorical data, where each day of the week is a separate category, and the height of each bar corresponds to the count or frequency of students waking up late on that specific day.
Note: Histograms, on the other hand, are more appropriate for visualizing continuous or numerical data and are not ideal for categorical data like days of the week.Histograms are useful for understanding the distribution of data, identifying patterns, and assessing the shape of the data distribution, such as whether it's normally distributed, skewed, or has multiple modes.
As you can see below, the Histogram is used to depict a pattern/continuous/rangedata. While a bar graph does just fine even with discrete data.


Correct Answer is C
Explanation
In direct proportion relation, we utilize the relationship as:
Variable∝Variable 2
Thus from the given case,
Force∝stretch
We introduce a constant term, K to remove the sign of proportionality as
Force=K* stretch
Let’s find the value of K, using Force=132 N and stretch of 0.07 m
132 N=K*0.07 m
K=132 N/0.07 m=1885.7 N/m
Now substitute this value of K in the following equation
Force=1885.7 N/m * stretch
For a stretch of 0.1 m, the force needed is
Force=1885.7 N/m * 0.1 m=188.57 N=188.6 N
Correct Answer is B
Explanation
100% represents total students four allied health program. Thus, 100%=800 students, and 19% joins respiratory care program is
Thus, 152 students joined the respiratory care program.
Correct Answer is C
Explanation
Given:
- Original price of the recliner: P
- Sale price (30% less than the original price): 0.7P
- Coupon saves an additional 25% off the sale price: 0.75 *0.7P = 0.525P
- The consumer pays $237 for the recliner.
We set up the equation:
0.525P = 237
Now, let's solve for P:
P = 237 / 0.525}
P = 451.428
Rounded to the nearest dollar, the original price of the recliner is approximately 451dollars.
Correct Answer is C
Explanation
In this case, we are measuring average weight of the babies with time. The weight of the babies will vary with time, meaning when we vary time, the average weight of the babies will be different. Here, time is independent while average weight is dependent variable.
Correct Answer is C
Explanation
A negative correlation means as one variable increases, the other variable decreases or as one variable decreases, the other variable increases. Based on this definition, we analyze the given statement as follows:
People who play baseball more tend to have more hits is POSITIVE CORRELATION
Shorter people tend to weigh less than taller people is a POSITIVE CORRELATION
Tennis balls that are older tend to have less bounce is a NEGATIVE CORRELATION
Cars that are older tend to have higher mileage is a POSITIVE CORRELATION
This question was extracted from the actual TEAS Exam. Ace your TEAS exam with the actual TEAS 7 questions, Start your journey with us today
Visit Naxlex, the Most Trusted TEAS TEST Platform With Guaranteed Pass of 90%.
Money back guarantee if you use our service and fail the actual exam. Option of personalised live tutor on your area of weakness.
