
Simplify the expression below. Which of the following is correct?
3.45 * 0.53
1.8285
18.285
0.18285
182.85
Correct Answer : A
To solve the equation this equation, we use a calculator and find the product as:
3.45 * 0.53 = 1.8285
TEAS 7 Exam Quiz Bank
HESI A2 Exam Quiz Bank
Find More Questions 📚
Teas 7 Questions: We got the latest updated TEAS 7 questions
100% Money Refund: 100% money back guarantee if you take our full
assessment pass with 80% and fail the actual exam.
Live Tutoring: Fully customized live tutoring lessons.
Guaranteed A Grade: All students who use our services pass with 90%
guarantee.
Related Questions
Correct Answer is A
Explanation
: We need to find the total rainfall for the months of May, June, and July using the given graph.
In the month of May, rainfall is between 3 and 4, which is halfway. Therefore, rainfall in May is 3.5 inches
On June, rainfall was 3 inch and on July the rainfall was 2.5 inches. Thus,
Total rainfall=3.5 inches+3 inches+ 2.5 inches=9.0 inches
Correct Answer is A
Explanation
we are asked to find the largest value from the options given. To solve this problem, we need to convert all the given values into fraction. Then find the least common denominator for all fractions, which we will use to multiply each fraction and make a comparison.
43÷ 55=43/55
5/7
0.729=729/1000
73%=73/100
Now, we need to find the least common denominator of 55, 7, 1000, and 100, which is 77000. We multiply each fraction by 77000 as follows:
43/55*77000=60200
5/7*77000=55000
729/1000*77000=56133
73/100*77000=56210
From the calculated values, it can be noted that 43/55 is the greatest value among the given options.
Correct Answer is A
Explanation
In this scenario, we use the given chart and scale provided to find the number of each coin and select the right number of coins the student collected.
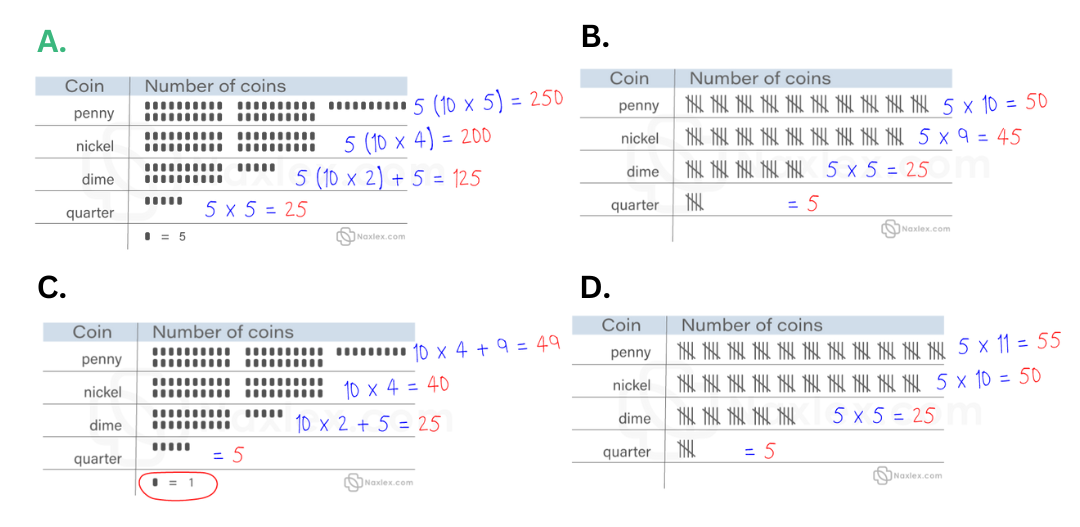
It is clear that the first choice if the correct answer. The child collected 250 pennies, 200 nickels, 125 dimes, and 25 quarters.
Correct Answer is D
Explanation
We need to find how many mL are in 5.5 teaspoons. We are told that 1 teaspoon is about 4.93 mL, which we interpret as follows:

Or

Since we are looking for mL, we use the second option.

Thus, 5.5 teaspoons can hold approximately 27 mL.
Correct Answer is D
Explanation
Let's calculate the number of each color of gumball:
- Red: 20% of 120 → 0.2×120=24
- Orange: 30% of 120 → 0.3×120=36
- Yellow: 5% of 120 → 0.05×120=6
- Green: 10% of 120 → 0.1×120=12
- Blue: The remaining percentage: 100%−(20%+30%+5%+10%) = 100%−65% =35%
- So, 0.35×120=42 blue gumballs.
Now, we find how many more blue gumballs there are than yellow:
42−6=36
Correct Answer is C
Explanation
We are needed to find the amount Jacob will be left with after spending and reinvesting the rest using the given information.
Amount Jacob spends=87% of $100=87/100*100=$87
Amount left to invest=$(100-87)=$13
Jacob is left with $13, which she invests and earns a profit of 75%.
Profit earned on invested amount=75% of $13=75/100*13=$9.75
So, Jacob will have $13+$9.75=$22.75
Correct Answer is D
Explanation
Before we compare the values of the options, we convert the decimals to fractions.
5.4 becomes 54/10
6.25 becomes 625/100
Thus, the set of fractions is 11/2, 54/10, 13/3, 625/100. The least common denominator for 2, 10, 3, and 100 is 300, which we use to compare each options given.
11/2*300=1650
54/10*300=1620
13/3*300=1300
625/100*300=1875
From the above, 1875 is the greatest value which corresponds to 6.25. Therefore, 6.25 is the greatest value of all the choices given.
Correct Answer is C
Explanation
The best way to visualize the student’s score for each subject is to plot them using a bar graph.
Correct Answer is D
Explanation
The babies' measured weights change over time and depend on the time interval after birth. Since weight is the outcome being measured, it is the dependent variable in the study.
Correct Answer is B
Explanation
Histograms are used to present frequency of data of one variable over the other. On the other hand, a bar graph is used to compare the two variables with the rectangles not touching one another as in histograms. Scatter plots are used to show the correlations between two variables. In this case, the teacher will be able to use scatter plot to establish the correlation between test scores and the subjects.
This question was extracted from the actual TEAS Exam. Ace your TEAS exam with the actual TEAS 7 questions, Start your journey with us today
Visit Naxlex, the Most Trusted TEAS TEST Platform With Guaranteed Pass of 90%.
Money back guarantee if you use our service and fail the actual exam. Option of personalised live tutor on your area of weakness.