
A baker is using a cookie recipe that call for 2 ¼ cups of flour to yield 36 cookies. How much flour will the baker need to make 90 cookies using the same recipe?
6 ¾ cups
5 5/8 cups
10 1/8 cups
4 ¾ cups
Correct Answer : B
We are asked to find the number of cups of flour that will be used to make 90 cookies.
Letting x be the number of cups of flour and setting the proportion equation with number of cookies on numerator and number of cups of flour on the denominator. We have
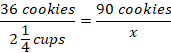
Solve the value of x by cross-multiplying

We convert the mixed fraction into improper fraction in order to carry out multiplication

\(x =\ \frac{9}{4}\ cups\ *\ 90\ cookies\ *\ \frac{1}{36}\ cookies\)
The number of cups of flour needed to make 90 cookies is 5.625 cups, which is equal to 5 5/8 cups(Choice B).
TEAS 7 Exam Quiz Bank
HESI A2 Exam Quiz Bank
Find More Questions 📚
Teas 7 Questions: We got the latest updated TEAS 7 questions
100% Money Refund: 100% money back guarantee if you take our full
assessment pass with 80% and fail the actual exam.
Live Tutoring: Fully customized live tutoring lessons.
Guaranteed A Grade: All students who use our services pass with 90%
guarantee.
Related Questions
Correct Answer is B
Explanation
We are asked to find the number of cups of flour that will be used to make 90 cookies.
Letting x be the number of cups of flour and setting the proportion equation with number of cookies on numerator and number of cups of flour on the denominator. We have
Solve the value of x by cross-multiplying
We convert the mixed fraction into improper fraction in order to carry out multiplication
\(x =\ \frac{9}{4}\ cups\ *\ 90\ cookies\ *\ \frac{1}{36}\ cookies\)
The number of cups of flour needed to make 90 cookies is 5.625 cups, which is equal to 5 5/8 cups(Choice B).
Correct Answer is D
Explanation
We are asked to find the Kwame’s uncle’s age in terms of Kwame’s age.
First, we need to find the age of Kwame, which is k. Then, we know that Kwame’s uncle’s age is three times that of Kwame less 17. Then,
Kwame’s uncle’s age, u = 3k-17.
Thus, the relation that relates Kwame’s uncle’s age to that of Kwame is u=3k-17.
Correct Answer is D
Explanation
The probability of an event is determined by the relation

Finding the probability of drawing the red ball, we need to find the total number of balls in the bag.
Total number of balls in the bag=5+4+3=12 balls

The probability of drawing a red ball from the bag is 1/3.
Correct Answer is A
Explanation
Step 1: Determine the remaining balance
The total cost of the television is $1,570, and the consumer made a $400 down payment.
Remainingbalance=1,570−400=1,170
Step 2: Calculate the number of months
The consumer pays $100 per month, so:
Months=1,170/100=11.7
Since the consumer cannot make a fraction of a payment, they will need 12 months to fully pay off the television.
Correct Answer is B
Explanation
We need to find the circumference of the circle from the given area.
To find the circumference, we need to find the radius of the circle from the given area.
Let r be the radius of the circle, and the area of the circle is given by

Substituting the value of area in the above equation becomes
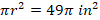
Dividing both sides by pi and taking square root on both sides yields
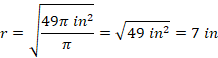
The radius of the circle is 7 in. and the circumference of the circle is given by the relation:

Correct Answer is B
Explanation
We need to find the value of x from the given equation. First, we move the value of 10 to the right-hand side of the equation.

Add 10 to both sides of the equation


Next, we apply the absolute rule:
 , a>0, then u=a or u=-a
In this case a=12, which is greater 0. Then, the first condition becomes

Solving for x



The second condition becomes

Solving for x



Then, the value of x is -1 or 2.
Correct Answer is C
Explanation
To calculate the percentage increase in client volume, use the formula:
PercentageIncrease ×100
×100
Step 1: Identify values
- Old Value (Year 1): 841 clients
- New Value (Year 2): 1,072 clients
Step 2: Compute the increase
1,072−841=231
Step 3: Calculate the percentage increase
 ×100 ≈ 27.47%
Step 4: Choose the closest answer
The closest option is 27%.
Correct Answer is A
Explanation
We follow the order of operations to solve the given expression.
First, we start with the numerator and solve it as follows
[2(3+5*3)]
We start with multiplication in inner brackets, 5*3=15. The expression becomes
[2(3+15)]
Then, we conduct the addition of 3+15=18. Then, the expression yields
[2(18)]=2*18=36
Now, we solve for denominator, which is 12/2=6.
Thus, the expression is reduced into
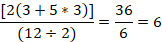
The expression reduces into 6.
Correct Answer is D
Explanation
A change in number of credit hours result in a change in the amount of access fees, amount of tuition, and availability of student loans. Thus, number of credit hours is the independent variable.
Correct Answer is D
Explanation
The slope represent the ratio between the vertical height to the horizontal length. Let x be the minimum length of the ramp, we can set a proportion with height on the numerator and length on denominator. Then,

Cross-multiply to find the value of x


Thus, the minimum length of the ramp needed is 30 feet to access to a door that is 2.5 feet above the sidewalk.
This question was extracted from the actual TEAS Exam. Ace your TEAS exam with the actual TEAS 7 questions, Start your journey with us today
Visit Naxlex, the Most Trusted TEAS TEST Platform With Guaranteed Pass of 90%.
Money back guarantee if you use our service and fail the actual exam. Option of personalised live tutor on your area of weakness.