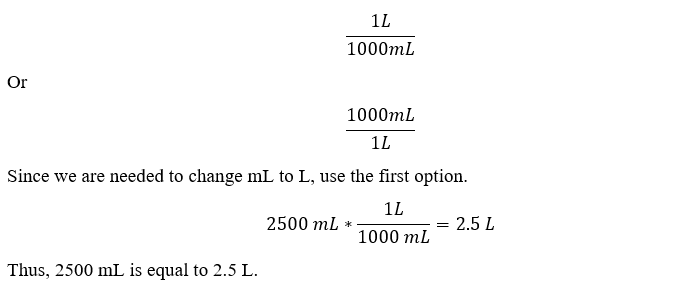
A bucket can hold 2500 mL. How many L can the bucket hold?
0.25 mL
25 mL
2.5 L
250 L
Correct Answer : C
Explanation: We know that 1 L=1000 mL and to change between L and mL we use the following two options

TEAS 7 Exam Quiz Bank
HESI A2 Exam Quiz Bank
Find More Questions 📚
Teas 7 Questions: We got the latest updated TEAS 7 questions
100% Money Refund: 100% money back guarantee if you take our full
assessment pass with 80% and fail the actual exam.
Live Tutoring: Fully customized live tutoring lessons.
Guaranteed A Grade: All students who use our services pass with 90%
guarantee.
Related Questions
Correct Answer is A
Explanation
To form an equation from the word problem, first break the given statement into smaller statements.
First, we are given the width of the rectangle as x. We are told, the length is two times width. Mathematically, this means
Length=2*width=2*x=2x
Now, the length is 6 less than 2 times width of the rectangle. Thus, the length of rectangle in terms of width becomes:
Length =2x-6
Thus, the length of the rectangle is 2x-6.
Correct Answer is D
Explanation
Before we compare the values of the options, we convert the decimals to fractions.
5.4 becomes 54/10
6.25 becomes 625/100
Thus, the set of fractions is 11/2, 54/10, 13/3, 625/100. The least common denominator for 2, 10, 3, and 100 is 300, which we use to compare each options given.
11/2*300=1650
54/10*300=1620
13/3*300=1300
625/100*300=1875
From the above, 1875 is the greatest value which corresponds to 6.25. Therefore, 6.25 is the greatest value of all the choices given.
Correct Answer is B
Explanation
to find the average time the athlete runs in 1 mile, find total time divided by total distance covered in the two runs.
Total distance=5+3=8 miles
Total time=25+15=40 minutes
We now know that the athlete runs 8 miles in 40 minutes, so the time the athlete will run in 1 mile will be:
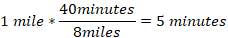
In 5 minutes, the athlete runs 1 mile.
Correct Answer is D
Explanation
The net income is the salary of the teacher gets after deducting total taxes.
Weekly net income=weekly gross income-total tax
Total tax=federal income tax+state income tax+Social Security tax
Total tax=$(72.00+35.00+65.00)
Total tax=$172.00
Weekly net income=$(730.00-172.00)=$558.00
The net income the teacher gets in 4 weeks is what she gets in one week multiplied by 4

The teacher will earn a net income of $2,232.00 in 4 weeks after taxes are deducted.
Correct Answer is C
Explanation
We asked to convert kg to pounds. There are two ways of converting between kg and pounds

And

Since we are to find pounds, we use the second option for kg to cancel
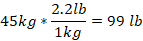
The pound equivalent of 45 kg is 99 lb.
Correct Answer is A
Explanation
We convert the given word problem into a mathematical expression.
Let the number be x.
Thrice a number = 3x
Twelve less than thrice a number = 3x-12
Thus, the required mathematical expression is 3x-12
Correct Answer is D
Explanation
correlations fall into positive, negative, and no correlation. A positive correlation shows that an increase in one variable increase results in an increase on the other variable increases as shown.
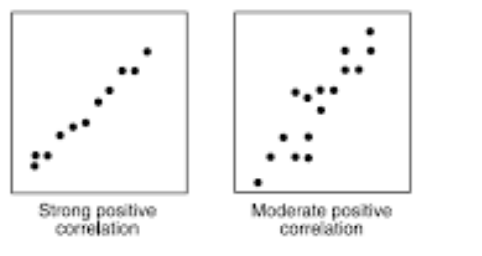
A negative correlation scatter plot shows that an increase in one variable results in a decrease on the other one.
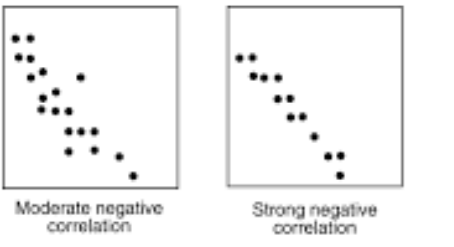
The no-correlation scatter plot demonstrates that there is no response between variables. A change in one variable has no effect on the other variable.
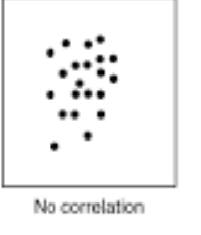
Looking at the provided scatter plot, the heights of the students does not have any relationship on the students’ scores. Thus, the type of correlation is no correlation.
Correct Answer is C
Explanation
We are needed to find the amount Jacob will be left with after spending and reinvesting the rest using the given information.
Amount Jacob spends=87% of $100=87/100*100=$87
Amount left to invest=$(100-87)=$13
Jacob is left with $13, which she invests and earns a profit of 75%.
Profit earned on invested amount=75% of $13=75/100*13=$9.75
So, Jacob will have $13+$9.75=$22.75
Correct Answer is D
Explanation
From the given estimations, we can find the exact sum after adding the given numbers and see the trend the student utilizes to find their estimates. The actual sum is as follows
26+180= 206
206
115+391= 506
506
497+2024= 2521
2521
From the above evaluation, the students round the exact sum to the nearest tens. So, in the problem we need to approximate 545+7501.
545+7501=8046
The exact sum is 8046 and the approximate value after rounding to the nearest tens is 8050.
Correct Answer is D
Explanation
Here we need to find the actual values of the additions and see the trend the student will use to estimate the given problem. The exact sum is as follows
35+192=227
258+350=608
947+1032=1979
From the above calculations, it is evident that the student rounds up or down the ones place values. So, in the problem we need to approximate 694+7618.
694+7618=8312
We can approximate 8312 based on the provided choices is 8310.
This question was extracted from the actual TEAS Exam. Ace your TEAS exam with the actual TEAS 7 questions, Start your journey with us today
Visit Naxlex, the Most Trusted TEAS TEST Platform With Guaranteed Pass of 90%.
Money back guarantee if you use our service and fail the actual exam. Option of personalised live tutor on your area of weakness.