A bucket can hold 5000 mL. How many L can the bucket hold?
500L
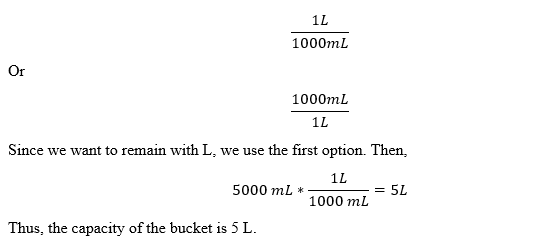
5L
50L
0.05L
Correct Answer : B
To change between L and mL, the following two options are used.
TEAS 7 Exam Quiz Bank
HESI A2 Exam Quiz Bank
Find More Questions 📚
Teas 7 Questions: We got the latest updated TEAS 7 questions
100% Money Refund: 100% money back guarantee if you take our full
assessment pass with 80% and fail the actual exam.
Live Tutoring: Fully customized live tutoring lessons.
Guaranteed A Grade: All students who use our services pass with 90%
guarantee.
Related Questions
Correct Answer is C
Explanation
In this problem, we need to find the amount of gratuity the couple will leave. The gratuity is 16% of the total bill. Before solving the problem, the following are terms and their meaning in percent problems:
- Is means equals
- Of means multiply
- What means unknown (variable)
If we let x be the amount of gratuity, then translating the given problem into a mathematical equation becomes:
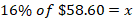
Now we evaluate the above equation noting that of means multiply.
So, the value of x=9.376 and to the nearest cent, x=9.38
There, a couple will leave a gratuity of $9.38.
Correct Answer is D
Explanation
We use the order of operation to solve for the unknown value of x.
3(3x+3)=8x+5
Multiply 3 with each number in the brackets
(3*3x)+(3*3)=8x+5
9x+9=8x+5
Subtract 9 from both sides
9x+9-9=8x+5-9
9x=8x-4
Subtract 8x on both sides
9x-8x=8x-8x-4
x=-4
Thus, the unknown value of x is -4.
Correct Answer is C
Explanation
Correlation of two variables falls into:
Positive correlation: an increase in one variable causes another variable to increase
Negative correlation: an increase in one variable causes another one to decrease
No correlation: a change in one variable does not cause any response in another variable.
From the given choices
Option a is no correlation
Option b is a no correlation
Option c is a negative correlation
Option d is a positive correlation
Correct Answer is C
Explanation
to find the average time the athlete runs in 1 mile; we find total distance and total time the athlete takes in running.
Total distance run by athlete=7+3=10 miles
Total time=45+15 =60 minutes
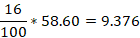
The athlete runs 10 miles in 60 minutes. For the athlete to cover 1 mile, he will run for a time less than 60 minutes. Thus, in 1 mile, the athlete takes:
So, in 6 minutes, the athlete covers 1 mile.
Correct Answer is D
Explanation
Here we convert between feet and yards. We know 1 yard =3 feet. Then, 27 feet to yards will be:
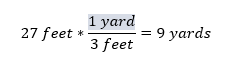
Thus, 9 yards is equal to 27 ft.
Correct Answer is B
Explanation
We need to find the radius of the circle from the given value of area. Then, the radius of the circle will be used to find the circumference of the circle.
The first step is to find the radius, r of the circle as
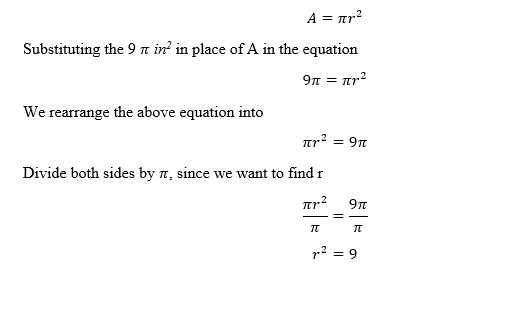
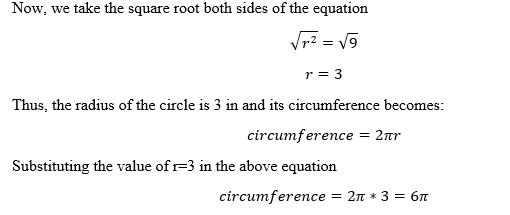
Thus, the circumference of a circle whose area is \(9\pi\ in\ ^2\)is 6  in.
in.
Correct Answer is B
Explanation
The median of a data set is found in two ways:
For an odd data set, the median fall in the (N+1)/2 th position.
For an even data set, the median is the average of the element in the (N/2)th and (N+1)/2 th positions.
To find the median of the given data set, we need to arrange the elements from the smallest to the largest as follows:
12, 12, 16, 18, 19, 22, 23, 24, 26, 35, 35
There are 11 elements in the data set. 11 is an odd number and the median fall in the (N+1)/2 th position.
Median =(11+1)/2=12/2=6 th position.
From the organized data, the element in the 6th position is 22, which is the required median for the data set.
Correct Answer is D
Explanation
Before finding the area of the pizza, we need to find the radius of the pizza.
Find radius of the pizza in terms of diameter
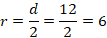
Next, find area of the pizza using the radius of 6 inches

Substituting r=6 in the equation of the area of a circle
Thus, the pizza has an area of 36 π in2.
Correct Answer is B
Explanation
In this scenario, we use the given scale in the charts to find the number of each coin and selected the right number of coins the student collected.
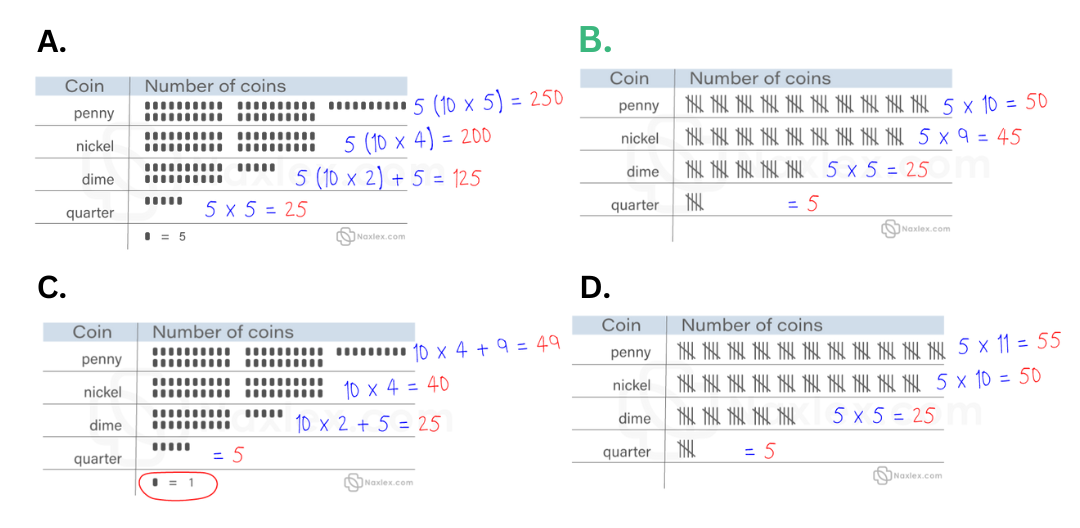
From the above evaluations, option two is the correct choice.
Correct Answer is D
Explanation
To solve the equation this equation, we compute the multiplication of the two numbers using the calculator
3.60 * 0.75 = 2.7
This question was extracted from the actual TEAS Exam. Ace your TEAS exam with the actual TEAS 7 questions, Start your journey with us today
Visit Naxlex, the Most Trusted TEAS TEST Platform With Guaranteed Pass of 90%.
Money back guarantee if you use our service and fail the actual exam. Option of personalised live tutor on your area of weakness.