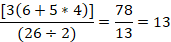
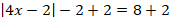
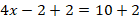
A child has collected 100 pennies, 90 nickels, 50 dimes, and 5 quarters. Which of the following charts accurately organizes the number of coins?
Chart 1
_1697528333.png)
Chart 2
_1697528348.png)
Chart 3
_1697528362.png)
Chart 4
_1697528375.png)
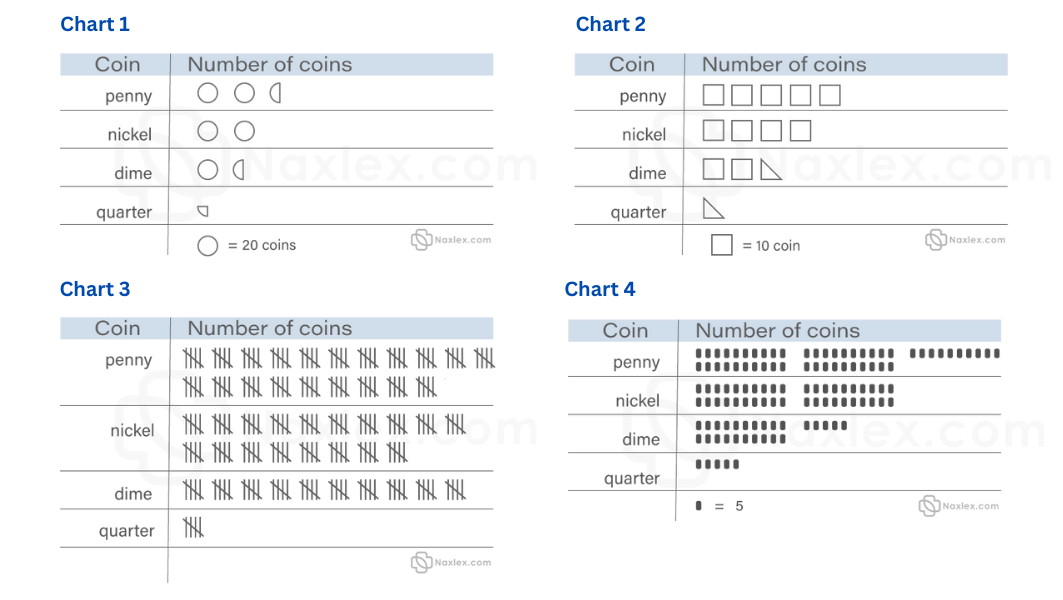
Chart 1
Chart 2
Chart 3
Chart 4
Correct Answer : C
C organizes the collection correctly.
TEAS 7 Exam Quiz Bank
HESI A2 Exam Quiz Bank
Find More Questions 📚
Teas 7 Questions: We got the latest updated TEAS 7 questions
100% Money Refund: 100% money back guarantee if you take our full
assessment pass with 80% and fail the actual exam.
Live Tutoring: Fully customized live tutoring lessons.
Guaranteed A Grade: All students who use our services pass with 90%
guarantee.
Related Questions
Correct Answer is A
Explanation
we are asked to find the number of gallons a full tank can hold. A full tank is equivalent to 1.
Convert the mixed fraction into proper fraction as follows
(2frac{2}{5}=frac{left(2ast5 ight)+2}{5}=frac{10+2}{5}=frac{12}{5})
If we let x be the number of gallons in full tank, and setting up the proportion equation with the number of gallons on the numerator and fraction of tank on denominator as follows.
(frac{x gallons}{1 full tank}=frac{frac{12}{5} gallons}{frac{4}{7}full tank})
Cross-multiply to find the value of x.
(frac{x }{1 full tank}=frac{frac{12}{5} gallons}{frac{4}{7}full tank})
(x astfrac{4}{7}full tank=frac{12}{5} gallonsast1 full tank)
(x =frac{frac{12}{5} gallonsast1 full tank}{frac{4}{7}full tank}=frac{12}{5}divfrac{4}{7} gallons=frac{12}{5}astfrac{7}{4}gallons=frac{21}{5}gallons)
Converting 21/5 to a mixed fraction is 4 1/5. Thus, when the tank is full, it holds 4 1/5 gallons of water.
Correct Answer is C
Explanation
We follow the order of operations to solve the given expression. The order of operations is PEMDAS:
- Parentheses
- Exponents
- Multiplication and Division (in order from left to right)
- Addition and Subtraction (in order from left to right)
First, we start with the numerator and solve it as follows
[3(6+5*4)]
We start with multiplication in parenthesis, 5*4=20. The expression becomes
[3(6+20)]
Then, we conduct the addition in parenthesis 6+20=26. Then, the expression becomes
[3(26)]=3*26=78
Now, we solve for denominator, which is 26/2=13.
Thus, the expression is reduced into
The expression reduces into 6.
Correct Answer is B
Explanation
we find the value of x by applying the absolute conditions to the given equation.
First, add 2 to both sides of equation


The absolute conditions are:
If  , a>0, then u=a or u=-a
In this case a=10, which is greater 0.
The first condition becomes

Add 2 to both sides of the equation

Divide both sides by 4


The second condition becomes

Add 2 to both sides of the equation

Divide both sides by 4


Then, the value of x is 3 or -2.
Correct Answer is D
Explanation
The median of a data set is a number that falls in the middle of the data set. To find the median, the numbers in the data set are arranged from the smallest to the largest. In the given data set, the organized arrangement is:
-5, -1, 0, 3, 9
There are five elements in the data set, and the median falls in the third position from either side. Thus, 0 falls in the third position.
Correct Answer is C
Explanation
Here, we are required to find the unit of measuring mass. The SI unit of mass is kilogram but other derived units are grams, milligrams, microgram and more.
A kilogram is a large quantity for measuring heavier objects but grams can used to measure small and light objects such as the mass of the mobile phone. Therefore, gram is the appropriate unit for measuring weight of a mobile phone.
Correct Answer is A
Explanation
A dependent variable is one that depends on the independent variable. An independent variable is one that when changed result in a change of another variable.
In this problem, if we change the brand of laptop, tax rate, and memory size, the price of the laptop changes. Thus, the cost of the laptop is the dependent variable.
Correct Answer is D
Explanation
We use the relation 1 L=1000 mL to convert L to mL.
The two options for converting between L and mL are

And

We use the first option to convert 6.5 L to mL as follows:
Thus, 6.5 L is 6500 mL.
Correct Answer is A
Explanation
We are tasked to find the stock price on Thursday from the given information. Here, we need to find the stock of each day from the price increase or decrease. If the price increases, we add to the previous day’s price and subtract if the price decreases.
Monday’s stock price=$65.50
Tuesday’s stock price is Monday’s plus $1.50=65.50+1.50=$67.00
Wednesday’s stock price went down by $2.57 from Tuesday’s=67.00-2.57=$64.43
Thursday’s stock price went up by $2.25 from Wednesday’s =64.43+2.25=$66.68
From the above evaluation, the stock price on Thursday was $66.68
Correct Answer is A
Explanation
A. A=w(2w+1)
Explanation
The area of a rectangle is given by the formula:
A=length×width
Given that the length is one more than twice the width, we can express it as:
Length=2w+1
The width is simply w.
Now, substituting these into the area formula:
A=w(2w+1)
Thus, the correct answer is:
A=w(2w+1)
Correct Answer is B
Explanation
To find the circumference of a circular garden, we can use the formula:
C=π×d
Where:
- C = Circumference
- π = 3.14 (as given)
- d = Diameter
Step 1: Substitute the given values into the formula
The diameter d is 14 metres, so:
C=3.14×14
Step 2: Perform the multiplication
C=43.96 metres
Final Answer:
The circumference of the garden is 43.96 metres.
The correct answer is B. 43.96 metres.
This question was extracted from the actual TEAS Exam. Ace your TEAS exam with the actual TEAS 7 questions, Start your journey with us today
Visit Naxlex, the Most Trusted TEAS TEST Platform With Guaranteed Pass of 90%.
Money back guarantee if you use our service and fail the actual exam. Option of personalised live tutor on your area of weakness.