A circle has an area of 49π in2. Which of the following is the circumference of the circle in terms of pi (π)?
14 π in
28 π in
7 π in
3.5 π in
Correct Answer : A
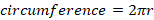
The initial step is to establish the relationship between area of a circle and the radius. The area of the circle is given by the formula

Now, substituting the 49 π in2 in place of A in the equation above becomes:

We want to find r, therefore, we rearrange the equation as

Divide both sides by 


Take square root both sides of the equation


The radius of the circle is 7 in, and the circumference of the circle is determined as follows
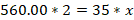
Substituting the value of r=7 becomes

Thus, the circumference of a circle whose area is 49  in2 is 14
TEAS 7 Exam Quiz Bank
HESI A2 Exam Quiz Bank
Find More Questions 📚
Teas 7 Questions: We got the latest updated TEAS 7 questions
100% Money Refund: 100% money back guarantee if you take our full
assessment pass with 80% and fail the actual exam.
Live Tutoring: Fully customized live tutoring lessons.
Guaranteed A Grade: All students who use our services pass with 90%
guarantee.
Related Questions
Correct Answer is A
Explanation
from the given estimations, we can find the actual addition of the numbers and see a trend the student utilizes to find their estimates. The exact sum is as follows
24+190=214
151+319=470
974+1022=1996
From the above evaluation, we can clearly see the students approximates the value in the ones values. So, in the problem we need to approximate 452+5017.
452+5017=5469
We can approximate 5469 based on the provided choices to 5470.
Correct Answer is C
Explanation
we follow the order operations to solve for the unknown value of x.
2(4x+3)=7x+5
Open the bracket on the LHS by multiplying each term by 2
(2*4x)+(2*3)=7x+5
8x+6=7x+5
Subtract 6 from both sides
8x+6-6=7x+5-6
8x=7x-1
Subtract 7x on both sides
8x-7x=7x-7x-1
X=-1
Thus, the value of unknown value of x is -1.
Correct Answer is D
Explanation
: we are to find the selling price of the sweater after subtracting the mark off price.
Mark off value=mark off rate*original price
Mark of value=25%*$87
We convert 25% into a fraction, which become 25/100=0.25. Then
Mark of value=0.25*$87=$21.75
The selling price of the sweater will be the original price less the mark off value. Then,

Thus, the approximate selling price of the sweater is $65.
Correct Answer is C
Explanation
the question requires we find the cost of two syringes.
If we let x be the cost of two syringes, then we set up a proportion equation with cost as numerator and number of syringes as denominator. The proportion equation becomes

Cross-multiply to solve for x

Rearranging the above

Divide both sides by 35


The cost of 2 syringes is $32.
Correct Answer is A
Explanation
we are needed to find the portion of pizza shared by 3 three friends. We treat the whole pizza as 1. Now, 1 friend eats half of the whole pizza. Thus,
One friend=1/2 of 1=1/2*1=1/2
Remaining amount=1-1/2=2/2-1/2=1/2
Thus, ½ of pizza is left for three friends to share among themselves. Then, each friend will get
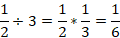
So, the other three friends will each get 1/6 of the pizza.
Correct Answer is D
Explanation
we use given information to find how much ammonia is need to make the specified solution.
We are told, one gallon of cleaning solution requires 6 oz of ammonia. In other words, we can express this as:
1 gallon of solution6 oz of ammonia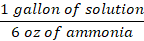
Or
6 oz of ammonia1 gallon of solution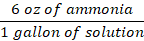
Since we are needed to find how much ammonia is needed, we use the second option to find how much ammonia is required by 120 gallons of solution.

From the above equation, gallon of solution will cancel, and oz of ammonia is left.
Therefore, the solution will require 720 oz of ammonia.
Correct Answer is A
Explanation
Based on the above data, the horizontal axis will be tree type and vertical axis will represent the number of trees.
Based on these, a bar graph is appropriate to represent the number trees.
Correct Answer is A
Explanation
The initial step is to convert the decimal numbers into fractions.
4.4 becomes 44/10
4.25 becomes 425/100
Thus, the set of fractions is 9/2, 44/10, 10/3, 425/100. The least common denominator for 2, 10, 3, and 100 is 300, which we use to compare each options given.
9/2*300=1350
44/10*300=1320
10/3*300=1000
425/100*300=1275
From the above, 1350 is the greatest value which corresponds to 9/2. Thus, 9/2 is the greatest value of all the choices given.
Correct Answer is D
Explanation
The first three months of the year are January, February, and March. We need to find the total rainfall for these three months from the provided graph.
In the month of January, rainfall is between o and 1, which is halfway. Therefore, rainfall in January is 0.5 inches
On February, rainfall was 1 inch and on March the rainfall was 2 inches. Thus,
Total rainfall = 0.5 inches + 1 inches + 2 inches = 3.5 inches
Correct Answer is C
Explanation
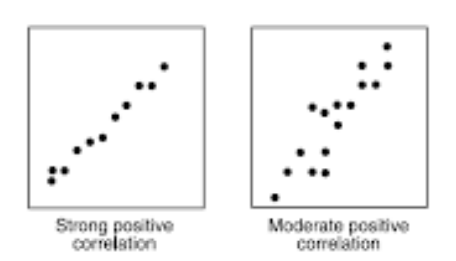
scatter plots can of three types: positive, negative and no correlation. A positive correlation scatter plot shows that as one variable increase, the other variable increases. A positive correlation can be visually depicted below.
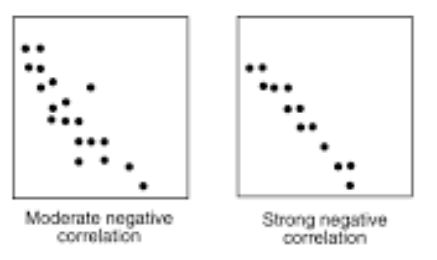
In a negative correlation, the change in one variable is inversely proportional to another variable. That is, as one variable increases, the other variable decreases as shown below.
The third type of scatter plot is a no-correlation scatter plot. In this type of plot, there is no defined relationship between one variable and another one as in the curve below.
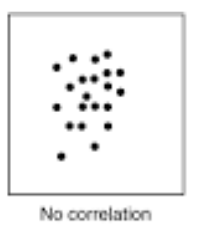
If we look at the relationship between the time the student listens to music and his test score, it is evident that no relationship exists between the two variables. Thus, this is a type of no correlation scatter plot.
This question was extracted from the actual TEAS Exam. Ace your TEAS exam with the actual TEAS 7 questions, Start your journey with us today
Visit Naxlex, the Most Trusted TEAS TEST Platform With Guaranteed Pass of 90%.
Money back guarantee if you use our service and fail the actual exam. Option of personalised live tutor on your area of weakness.