A farmer grows apple, orange, lemon, banana, and pear trees. The number of trees planted this year is shown in table above. Which of the following would best display the data?
|
Tree type |
Apple |
Orange |
Lemon |
Banana |
Pear |
|
Number of trees |
20 |
10 |
12 |
25 |
21 |
Bar graph
Stem and leaf plot
Line graph
Scatter plot
Correct Answer : A
Based on the above data, the horizontal axis will be tree type and vertical axis will represent the number of trees.
Based on these, a bar graph is appropriate to represent the number trees.
TEAS 7 Exam Quiz Bank
HESI A2 Exam Quiz Bank
Find More Questions 📚
Teas 7 Questions: We got the latest updated TEAS 7 questions
100% Money Refund: 100% money back guarantee if you take our full
assessment pass with 80% and fail the actual exam.
Live Tutoring: Fully customized live tutoring lessons.
Guaranteed A Grade: All students who use our services pass with 90%
guarantee.
Related Questions
Correct Answer is A
Explanation
We asked to convert kg to pounds. There are two ways of converting between kg and pounds

And

Since we are asked to find pounds, we use the second option for kg to cancel during conversion as follows:
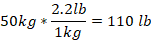
Thus, 50 kg is equal to 110 lb.
Correct Answer is B
Explanation
We need to find how many mL are in 2.5 teaspoons. We need to use dimensional analysis to solve this problem as follows.
Converting between teaspoon and mL uses the following conversions:

Or

We want to end up with mL, we utilize the second conversion and set up the following equation.
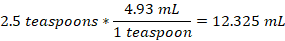
Thus, 2.5 teaspoons can hold 12.325 mL.
Correct Answer is B
Explanation
we are asked to find the largest value from the options given. To solve this problem, we need to convert all the given values into fraction. Then find the least common denominator for all fractions, which we will use to multiply each fraction and make a comparison.
34÷96=
3/8=3/8
0.372=372/1000
37%=37/100
Now, we need to find the least common denominator of 48, 8, 1000, and 100, which is 6000. We multiply each fraction by 6000 as follows:
17/48*6000=2125
3/8*6000=2250
372/1000*6000=2232
37/100*6000=2220
From the above calculations, arranging the fraction from the largest to the smallest in order is: 3/8, 372/1000,37/100, and 17/48. Thus, the greatest value is 3/8.
Correct Answer is C
Explanation
an independent variable is one that when changed, causes the other variable(s) to change. In our case, calories burned, distance traveled, energy used increase when cycling speed increases.
Therefore, speed is the independent variable while other variables are dependent.
Correct Answer is A
Explanation
we are needed to find the amount Lana is left with after spending and investing the rest using the given information.
Amount Lana spends = 80% of $60= 80/100 *60 = $48
Amount left to invest = $(60-48) = $12
Lana is left with $12, which she invests and earns a profit of 80%.
Profit earned = 80% of $12 = 80/100 * 12= $9.20
So, Lana will have $12 + $9.20 = $21.60
Correct Answer is B
Explanation
in the given problem, we use the calculator to find 1.3*0.47=0.611
Correct Answer is D
Explanation
a ratio can be converted to a fraction of the form a/b, where b is not equal to zero. In ratio form, to means per.
From the given information, the class has 15 girls and 13 boys. Thus, the ratio of girls to boys becomes:

In ratio form, girls: boys=15:13
Thus, the ratio of girls to boys in a class of 28 students is 15 to 13.
Correct Answer is C
Explanation
the question requires we find the cost of two syringes.
If we let x be the cost of two syringes, then we set up a proportion equation with cost as numerator and number of syringes as denominator. The proportion equation becomes

Cross-multiply to solve for x


Rearranging the above

Divide both sides by 35


The cost of 2 syringes is $32.
Correct Answer is B
Explanation
here we use the US customary system to convert between yards and feet. We use the conversion 1 yard =3 feet. Then, 6 yards to ft is found as
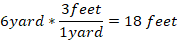
Thus, 6 yards is equal to 18 ft.
Correct Answer is C
Explanation
to find the average time the athlete runs in 1 mile, find total time divided by total distance covered.
Total distance=4+4=8 miles
Total time=28+32 =60 minutes
From the above, the athlete runs 8 miles in 60 minutes, so the athlete will take how minutes to cover 1 mile.
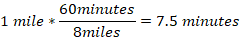
So, the athlete covers 1 mile in 7.5 minutes.
This question was extracted from the actual TEAS Exam. Ace your TEAS exam with the actual TEAS 7 questions, Start your journey with us today
Visit Naxlex, the Most Trusted TEAS TEST Platform With Guaranteed Pass of 90%.
Money back guarantee if you use our service and fail the actual exam. Option of personalised live tutor on your area of weakness.