A garden in the shape of a square has an area of 13 square feet. Each side of the garden has a length of √13 feet. Which of the following is the best decimal approximation for the length of each side?
4.5 feet
6.5 feet
3.6 feet
2.6 feet
Correct Answer : C
In this problem, to find one side of the square garden, we use the calculator to find the square root of 13. Thus
Thus, the approximate side of a square garden is about 3.6 ft
TEAS 7 Exam Quiz Bank
HESI A2 Exam Quiz Bank
Find More Questions 📚
Teas 7 Questions: We got the latest updated TEAS 7 questions
100% Money Refund: 100% money back guarantee if you take our full
assessment pass with 80% and fail the actual exam.
Live Tutoring: Fully customized live tutoring lessons.
Guaranteed A Grade: All students who use our services pass with 90%
guarantee.
Related Questions
Correct Answer is A
Explanation
Here we collect like terms together and solve for the unknown value of x.
7x-6=3x-26
Add 6 to both sides of the equation
7x-6+6=3x-26+6
7x=3x-20
Subtract 3x from both sides of the equation
7x-3x=-20
4x=-20
Divide both sides by 4
4x/-4=-20/4
x = -5
The value of x = -5
Correct Answer is D
Explanation
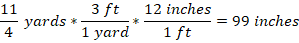
we use the US customary system of units’ equivalent to convert from yards to inches. We know that 1yard=3 ft, and 1 ft =12 inches.
First, convert 2 ¾ into an improper fraction.
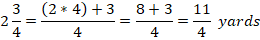
Then,
Correct Answer is B
Explanation
total muffin is equal to the sum of the different muffins sold.
Total muffins=41+27+20=88 muffins
Thus, the bakery sold about 90 muffins.
Correct Answer is A
Explanation
Let xxx be the amount the friend paid for their car. The problem states:
48,000=2x−2,000
Step 1: Solve for x
Add 2,000 to both sides:
48,000+2,000=2x
Divide by 2:
x=25,000
Correct Answer is C
Explanation
In this problem, to find one side of the square garden, we use the calculator to find the square root of 13. Thus
Thus, the approximate side of a square garden is about 3.6 ft
Correct Answer is B
Explanation
The best way to display the frequency of each day of the week when students get up after 8 a.m. is by using a bar graph. Bar graphs are well-suited for representing categorical data, where each day of the week is a separate category, and the height of each bar corresponds to the count or frequency of students waking up late on that specific day.
Note: Histograms, on the other hand, are more appropriate for visualizing continuous or numerical data and are not ideal for categorical data like days of the week.Histograms are useful for understanding the distribution of data, identifying patterns, and assessing the shape of the data distribution, such as whether it's normally distributed, skewed, or has multiple modes.
As you can see below, the Histogram is used to depict a pattern/continuous data. While a bar graph does just fine even with discrete data.


Correct Answer is B
Explanation
The median temperature can be found by organizing the temperature values from the smallest to the largest value as follows:
98.6, 98.7, 99.0, 99.0,99.2, 99.3, 99.7, 100.0
(for an even set of numbers, Median = frac{(frac{n}{2})th observation + (frac{n}{2} + 1) th observation}{2})
From the data set above, there are 8temperature values. The median is the temperature value in the middle position, which falls between the(frac{n}{2} th)and((frac{n}{2} + 1) th) position. Here N=8and median is found as:
(frac{(frac{n}{2})th + (frac{n}{2} + 1) th}{2} = )(frac{(frac{8}{2})th + (frac{8}{2} + 1) th }{2} = 4.5th position)
The element in the 4.5th position is the average of the 4th and 5th element.
(frac{99.0 + 99.2}{2} = 99.1)
Thus 99.1 is the median temperature.
Correct Answer is D
Explanation
Looking at the given trend, it is observed that the price increases with years. From 2008 to 2012, the price is fairly constant but we expect it to be more than $130,000 in the year 2016. The expected price in 2016 is $140,000.
Correct Answer is D
Explanation
We solve the problem by first finding the amount of gallons needed for the whole trip then find the cost of the gallon.
The car uses 1 gallon to cover 25 miles, which is same as:

Now, in 3000 miles, the car will use how many gallons of gasoline?
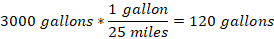
A trip of 3000 miles will need 120 gallons. And to find the cost of 120 gallons, we proceed as follows:
The family will spend $199.20 to drive for 3000 miles.
Correct Answer is A
Explanation
to do a comparison of the given data set, we convert the fraction numbers into the approximate decimals.
4/3=1.333
2720=1.35
Now, we have 1.333, 1.35, 1.369, 1.357. These numbers are arranged from the smallest to the largest number, we look at the number in the second decimal place value
1.333 the number in second decimal place value is 3
1.35 the number in third decimal place value is 5
1.369 the number in third decimal place value is 6
1.357 the number in third decimal place value is 5
However, 1.35 and 1.357 have 5 in the second-place vale. We use the ird place value to compare the two number:
1.35 is same as 1.350 and the number in the third-place value is 0
1.357 the number in the third-place value is 7
Now, 0 is less than 7, and thus 1.35 is less than 1.357
Overall, 3 is less than 5, and 5 less than 6 and the provided numbers can be arranged from the smallest to the largest as:
1.333, 1.35, 1.357, 1.369
Thus, the corresponding given numbers organized from the smallest to the largest become:
4/3, 27/20, 1.357, 1.369
The greatest value is 1.369
This question was extracted from the actual TEAS Exam. Ace your TEAS exam with the actual TEAS 7 questions, Start your journey with us today
Visit Naxlex, the Most Trusted TEAS TEST Platform With Guaranteed Pass of 90%.
Money back guarantee if you use our service and fail the actual exam. Option of personalised live tutor on your area of weakness.