A large pizza has a diameter of 12 inches. Which of the following is the area of the pizza in terms of pi ( )?
)?
24 πi n2
48 π in2
18π in2
36 π in2
Correct Answer : D
Before finding the area of the pizza, we need to find the radius of the pizza.
Find radius of the pizza in terms of diameter
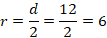
Next, find area of the pizza using the radius of 6 inches

Substituting r=6 in the equation of the area of a circle
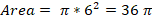
Thus, the pizza has an area of 36 π in2.
TEAS 7 Exam Quiz Bank
HESI A2 Exam Quiz Bank
Find More Questions 📚
Teas 7 Questions: We got the latest updated TEAS 7 questions
100% Money Refund: 100% money back guarantee if you take our full
assessment pass with 80% and fail the actual exam.
Live Tutoring: Fully customized live tutoring lessons.
Guaranteed A Grade: All students who use our services pass with 90%
guarantee.
Related Questions
Correct Answer is D
Explanation
Based rainfall falling for the first 5 months, a bar graph will give a great display for the farmer to decide when start planting. The horizontal scale will represent months of the year and vertical scale will present the amount of rainfall falling.
Correct Answer is C
Explanation
In a bell-shaped curve, the data distribution is symmetric around a single peak. The centering of data around a single peak means the mean, mode and median of the test are all equal to each other.
Correct Answer is B
Explanation
To change between L and mL, the following two options are used.
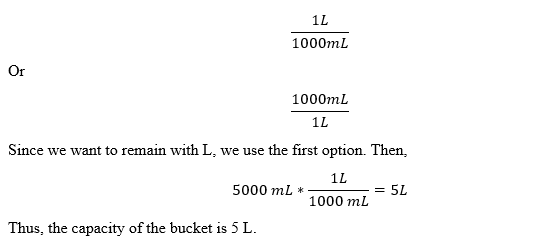
Correct Answer is C
Explanation
to find the average time the athlete runs in 1 mile; we find total distance and total time the athlete takes in running.
Total distance run by athlete=7+3=10 miles
Total time=45+15 =60 minutes
The athlete runs 10 miles in 60 minutes. For the athlete to cover 1 mile, he will run for a time less than 60 minutes. Thus, in 1 mile, the athlete takes:
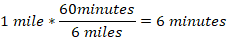
So, in 6 minutes, the athlete covers 1 mile.
Correct Answer is A
Explanation
The first five months of the year are January, February, March, April, and May. We use to graph to find the amount of rainfall in each month as follows:
In the month of January, rainfall was between o and 1, which is halfway. Therefore, rainfall in January is 0.5 inches
On February, rainfall was 1 inch and on March the rainfall was 2 inches.
On April, the rainfall amount was 4 inches while on month of May, the rainfall was about 3.5 inches. Therefore, total rainfall in the first 5 months was:
Total rainfall=0.5 inches+1 inches+ 2 inches+4 inches + 3.5 inches =11 inches
Correct Answer is A
Explanation
The selling price of the sweater is marked price less the mark off value.
Mark off value=mark off rate*original price
Mark of value=30% of $95
Mark of value=0.30*$95=$28.50
Now, find the selling price of the sweater
Selling price= marked price-mark off value

Thus, the sweater will be sold for 66.50 after applying a mark off of 30%. The selling price is about $67.
Correct Answer is D
Explanation
From the cost of 45 syringes, we are required to find the cost of 5 syringes. We set up a proportion equation by letting the cost of 5 syringes to y. Besides, we let the cost to be numerator and number of syringes to be denominator as follows.

Solve the value of y by cross products


Divide both sides by 45
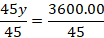

Therefore, 5 syringes will cost $80.00.
Correct Answer is A
Explanation
A ratio is of the form a : b but can also be converted to a fraction of the form a/b, where b is not equal to zero. Besides, to in ration means per in fraction form.
In the class of 40 students, 22 are girls and 18 are boys. Thus, the ratio of girls to boys becomes:

The above fraction can be reduced further since 2 is a common factor in both 22 and 18. Thus
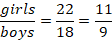
In ratio form, girls: boys=11:9
Thus, the ratio of girls to boys in a class of 40 students is 11 to 9.
Correct Answer is A
Explanation
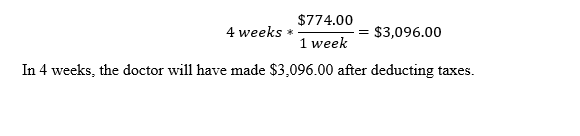
We are required to find the doctor’s earning in 4 weeks after taking off taxes.
The first step is to find the total weekly deductions as follows:
Total weekly tax=federal income tax + state income tax + Social Security tax
Total weekly tax=$(85.00+40.00+81.00)
Total tax=$206.00
The next step is to find the weekly income after deducting total taxes
Weekly net income=gross income-total tax
Weekly net income=$(980.00-206.00)=$774.00
In one week, the net income of the doctor is $774.00 and after 4 weeks, the net income will be 4 times his weekly earning
Correct Answer is A
Explanation
We solve for the value of x by following the order of operations
3(x-2)=15
Divide both sides of the equation by 3


Add 2 to both sides of the equation
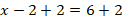

Thus, the value of x is 8.
This question was extracted from the actual TEAS Exam. Ace your TEAS exam with the actual TEAS 7 questions, Start your journey with us today
Visit Naxlex, the Most Trusted TEAS TEST Platform With Guaranteed Pass of 90%.
Money back guarantee if you use our service and fail the actual exam. Option of personalised live tutor on your area of weakness.