A patient's temperature was recorded in degrees Fahrenheit every hour for 8 hr. The temperatures in Fahrenheit were 99.0°, 99.2°, 98.7°, 99.3°, 99.7°, 98.6°, 100.0° and 99.0°. Which of the following is the median temperature?
99.5°F
99.1°F
99.2°F
99°F
Correct Answer : B
The median temperature can be found by organizing the temperature values from the smallest to the largest value as follows:
98.6, 98.7, 99.0, 99.0, 99.2, 99.3, 99.7, 100.0
(for an even set of numbers, Median = frac{(frac{n}{2})th observation + (frac{n}{2} + 1) th observation}{2})
From the data set above, there are 8 temperature values. The median is the temperature value in the middle position, which falls between the (frac{n}{2} th) and ((frac{n}{2} + 1) th) position. Here N=8 and median is found as:
(frac{(frac{n}{2})th + (frac{n}{2} + 1) th}{2} = )(frac{(frac{8}{2})th + (frac{8}{2} + 1) th }{2} = 4.5th position)
The element in the 4.5th position is the average of the 4th and 5th element.
(frac{99.0 + 99.2}{2} = 99.1)
Thus 99.1 is the median temperature.
TEAS 7 Exam Quiz Bank
HESI A2 Exam Quiz Bank
Find More Questions 📚
Teas 7 Questions: We got the latest updated TEAS 7 questions
100% Money Refund: 100% money back guarantee if you take our full
assessment pass with 80% and fail the actual exam.
Live Tutoring: Fully customized live tutoring lessons.
Guaranteed A Grade: All students who use our services pass with 90%
guarantee.
Related Questions
Correct Answer is B
Explanation
In the simple interest, we utilize the following formula to find the simple interest after a period of time in years.
I=P*r*t
I is the interest
P=Principal or initial deposit
r=rate
t=time in years
From the given problem, P=$600, r=6%=6/100=0.06, t=5 years. Then
I=$600*0.06*5=$180
After 5 years, Pat will earn an interest of $180.
Correct Answer is A
Explanation
A whole pizza is equivalent to 1. Then
One friend eats half of the pizza=1/2 of 1=1/2*1=1/2
Remaining amount of pizza to be shared=1-1/2=2/2-1/2=1/2
Now, three friends share ½ equally and each friend will get,
Thus, the three friends each share 1/6.
Correct Answer is A
Explanation
to solve for x, we order like terms together and proceed as follows:
4x-3-5x=24
Add 3 to both sides of the equation
4x-3+3-5x=24+3
4x+3-3-5x=27
4x-5x=27
-x=27
Divide both sides by -1
-x/-1=27/-1
x= -27
Thus, the unknown value of x is -27
Correct Answer is B
Explanation
From the given scenario:
Initial charge is $40
Additional charge per circular cloth=$5c
Additional charge per rectangular cloth=$3.50r
Total cost = additional charge per circular rectangular cloths + Initial charge
Total cost, T = 5c + 3.5r + 40
Correct Answer is B
Explanation
Here we are required to find the area of the square of sides 3.1 m. The square is a four-sided figure with each side equal and opposite sides making 90 degrees.

Area of the square =side*side
Side=3.1 m
Area of the square =3.1 m *3.1 m=9.61 m2
Note: 3.1 + 3.1 = 6.2 which is a wrong answer.
Correct Answer is C
Explanation
When dividing fractions, the division sign is changed into multiply sign and the first fraction is multiplied by the inverse of the second fraction.

Change division to multiply sign and find invers of 5/8. The inverse of a fraction is inverting the given fraction. The denominator becomes the numerator and the numerator becomes the denominator.

Correct Answer is A
Explanation
In this problem, we take the triangle as a right-angled triangle and label it as follows:
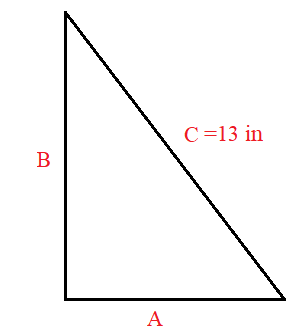
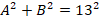
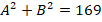
From the Pythagoras theorem A2 + B2= C2, we can look for a combination of A and B that when the squares of A and B are summed give a square of 13. Mathematically,

But C=13 inches
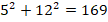
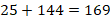
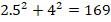
If we take A=5 inches and B=12 inches, then

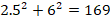
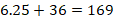
Next, we take A=2.5 inches, B=6 inches

Next, we take A=2.5 inches, B=4 inches
6.25+16=169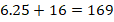
22.25≠169
Taking A=5 inches and B=8 inches

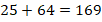

From the above computation, the combination of A=5 inches and B=12 inches give a triangle with a hypothenuse of 13 inches.
Correct Answer is D
Explanation
Percentages always add up to 100%. If we let x be the percent of graduates working for jobs unrelated to law, then
74%+3%+2%+x=100%
79%+x=100%
Subtract 79% from both sides of the equation
79%-79%+x=100%
x=100%-79%
x=21%
So, the number of graduates working for jobs unrelated to law is 21%.
Correct Answer is D
Explanation
The given ratio of yoghurt to toppings is 4:3, meaning:
Yoghurt : toppings =4 : 3
We are given 4.5 oz of toppings and need to find the amount of yoghurt.
Step 1: Set up the proportion
 =
= 
Step 2: Solve for yoghurt
Multiply both sides by 4.5:
yoghurt=43×4.5
yoghurt=4×4.5/3=18/3=6oz
Correct Answer is D
Explanation
Looking at the given trend, it is observed that the price increases with years. From 2008 to 2012, the price is fairly constant but we expect it to be more than $130,000 in the year 2016. The expected price in 2016 is $140,000.
This question was extracted from the actual TEAS Exam. Ace your TEAS exam with the actual TEAS 7 questions, Start your journey with us today
Visit Naxlex, the Most Trusted TEAS TEST Platform With Guaranteed Pass of 90%.
Money back guarantee if you use our service and fail the actual exam. Option of personalised live tutor on your area of weakness.