A recipe calls for 2.5 teaspoons of vanilla, 1 teaspoon equals approximately 4.93 mL. Which of the following is the correct amount of vanilla in mL?
12.325 mL
5.32 mL
7.43 mL
0.507 mL
Correct Answer : A
We are given that 1 teaspoon=4.93 mL, we can interpret it as:

Or

Since we are to find the amount in mL, we look for an option that will cancel teaspoon and remain with mL. The second option is the required conversion, and we proceed as follows:
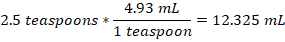
Therefore, 2.5 teaspoons hold about 12.325 mL.
TEAS 7 Exam Quiz Bank
HESI A2 Exam Quiz Bank
Find More Questions 📚
Teas 7 Questions: We got the latest updated TEAS 7 questions
100% Money Refund: 100% money back guarantee if you take our full
assessment pass with 80% and fail the actual exam.
Live Tutoring: Fully customized live tutoring lessons.
Guaranteed A Grade: All students who use our services pass with 90%
guarantee.
Related Questions
Correct Answer is B
Explanation
The best way to display the frequency of each day of the week when students get up after 8 a.m. is by using a bar graph. Bar graphs are well-suited for representing categorical data, where each day of the week is a separate category, and the height of each bar corresponds to the count or frequency of students waking up late on that specific day.
Note: Histograms, on the other hand, are more appropriate for visualizing continuous or numerical data and are not ideal for categorical data like days of the week.Histograms are useful for understanding the distribution of data, identifying patterns, and assessing the shape of the data distribution, such as whether it's normally distributed, skewed, or has multiple modes.
As you can see below, the Histogram is used to depict a pattern/continuous data. While a bar graph does just fine even with discrete data.


Correct Answer is D
Explanation
A teaspoon can approximately hold 5 mL.
Although the capacity of a teaspoon could be more or less, choice D remains the most correct answer as the other choices have amounts too much for a small teaspoon.
Correct Answer is B
Explanation
total muffin is equal to the sum of the different muffins sold.
Total muffins=41+27+20=88 muffins
Thus, the bakery sold about 90 muffins.
Correct Answer is D
Explanation
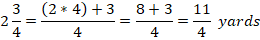
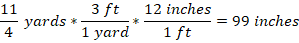
we use the US customary system of units’ equivalent to convert from yards to inches. We know that 1yard=3 ft, and 1 ft =12 inches.
First, convert 2 ¾ into an improper fraction.
Then,
Correct Answer is A
Explanation
all products represent 100%. Then, the portion of defect products is:
0.0025 of 100%
‘of’ means multiply
0.0025 *100%=0.25%
Correct Answer is B
Explanation
Here we are required to find the area of the square of sides 3.1 m. The square is a four-sided figure with each side equal and opposite sides making 90 degrees.

Area of the square =side*side
Side=3.1 m
Area of the square =3.1 m *3.1 m=9.61 m2
Note: 3.1 + 3.1 = 6.2 which is a wrong answer.
Correct Answer is A
Explanation
From the given options, we can arrange the numbers from the smallest to the largest as:
-271.906, -193.823, 145.884, 235.971
From the above, it can be noted that -271 is less than -193 while 235 is more than 145.
Correct Answer is D
Explanation
Round trip means to and from, which is twice the distance from home to a medical facility.
In one day, the round trip=19+19=38 miles
So, in 22 days, the round trip=38*22=836 miles.
The patient will cover 836 miles in 22 days.
Correct Answer is C
Explanation
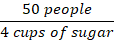
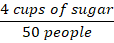
We need to perform a series of numerical dimensional analysis to find the number of bags sugar needed for 300 people.
We are told that 50 people need 4 cups of sugar. This can be interpretated as:
Or
Also, one bag of sugar contains 6 cups. This can also be presented as:
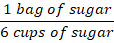
Or
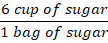
We use the second option relating number of people and cups, and second option relating cups of sugar and bag of sugar to find for number of bags of sugar needed for 300 people.

Therefore, 300 people will need 4 bags of sugar.
Correct Answer is A
Explanation
From the given problem,
49.5 pounds of fertilizer is needed to farm 1 acre of land. This can be interpreted as:

Or

Now we are needed to find the acres of land that will be farmed using 2000 pounds of fertilizers. To solve this, we use the second option as follows:

2000 pounds of fertilizers can farm approximately 40 acres of land.
This question was extracted from the actual TEAS Exam. Ace your TEAS exam with the actual TEAS 7 questions, Start your journey with us today
Visit Naxlex, the Most Trusted TEAS TEST Platform With Guaranteed Pass of 90%.
Money back guarantee if you use our service and fail the actual exam. Option of personalised live tutor on your area of weakness.