A teacher has asked all the students in the class what is their favorite color is and separates the responses into five categories. The results are shown in the table below. which of the following is the best way to display the frequency for each color?
| Color | Red | Black | Green | White | Other |
|---|---|---|---|---|---|
|
Number of students |
12 | 25 | 8 | 5 | 10 |
Histogram
Pie chart
Scatter plot
Line graph
Correct Answer : B
A histogram is used to visualize the frequency of a one variable over the other while a line graph is used to compare two variables.
A scatter plot used to show the correlation between two variables.
A pie chart is used to show the proportion of the given information in circle, with each section of a circle representing a given fraction of a whole.
From the given information, a pie chart is an appropriate tool show the frequency of the students choosing their favorite color.
TEAS 7 Exam Quiz Bank
HESI A2 Exam Quiz Bank
Find More Questions 📚
Teas 7 Questions: We got the latest updated TEAS 7 questions
100% Money Refund: 100% money back guarantee if you take our full
assessment pass with 80% and fail the actual exam.
Live Tutoring: Fully customized live tutoring lessons.
Guaranteed A Grade: All students who use our services pass with 90%
guarantee.
Related Questions
Correct Answer is D
Explanation
We are asked to find the number of students enrolled in the radiologic program using the information provided on the pie chart.
If we let x represent the number of students enrolled in the radiologic program, we set a proportion equation with number of students on the numerator and percentages on the denominator.
Total percent in the pie chart adds to 100%, which equals 1200 students. Then, 21% will represent
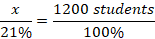
We solve the value of x by cross-multiplying the equation above.
Therefore, 252 students will enroll for a radiologic program.
Correct Answer is A
Explanation
To find the cheapest option, we find the amount the consume will spend for each option given.:
- 2 packs of Orange and 1 pack of Cream Soda will cost $16+$5= $21
- 3 Packs of Orange will cost $16+$12=$28
- 2 packs of Root Beer and 1 pack of Cream Soda will cost 2($15)+$7=$37
- 5 packs of cream Soda will cost 5($7)=$35
From the above evaluation, the cheapest option will cost the consumer $21. Thus, buying 2 packs of Orange and 1 pack of Cream Soda will be cheaper to purchase compared to other options.
Correct Answer is D
Explanation
To find the greatest number from the given options, convert the decimal numbers into fractions.
6.98 becomes 698/100
9.2 becomes 92/10
The least common denominator for the denominators of 7, 100 and 10 is 700. Now we can multiply each fraction with 700 as follows:
3/7*700=300
698/100*700=4886
10/7*700=1000
92/10*700=6440
In order from the smallest to largest, we organize the number set as follows:
3/7, 10/7, 6.98, 9.2.
Thus, 9.2 is the greatest of all.
Correct Answer is D
Explanation
Given:
- 2 teaspoons of baking powder for every ½ cup of flour.
- We are using 5 cups of flour.
Step 1: Determine how many teaspoons are needed per cup of flour.
Since the recipe calls for 2 teaspoons for every ½ cup of flour, the number of teaspoons required for 1 full cup of flour would be:
2 teaspoons×2=4 teaspoonspercup.
Step 2: Calculate how many teaspoons are needed for 5 cups of flour.
Now, multiply the number of teaspoons needed for 1 cup of flour by 5:
4 teaspoonspercup×5 cups=20 teaspoons.
Thus, the number of teaspoons of baking powder needed for 5 cups of flour is 20 teaspoons.
Therefore, the correct answer is D. 20 tsp.
Correct Answer is B
Explanation
The percentage change in weight is found in three steps below:
Absolute change in weight=final weight-initial weight
Absolute change in weight=(left|120-153 ight|=left|-33 ight|=33)
Relative change in weight=(frac{absolute change}{initial weight}=frac{33}{153}=0.216)
Percent change=relative change * 100%
Percent change=0.216*100%=21.6%
The percent change in weight lost is 21.6 %, which is about 22%.
Correct Answer is A
Explanation
We are tasked to find the stock price on Thursday from the given information. Here, we need to find the stock of each day from the price increase or decrease. If the price increases, we add to the previous day’s price and subtract if the price decreases.
Monday’s stock price=$65.50
Tuesday’s stock price is Monday’s plus $1.50=65.50+1.50=$67.00
Wednesday’s stock price went down by $2.57 from Tuesday’s=67.00-2.57=$64.43
Thursday’s stock price went up by $2.25 from Wednesday’s =64.43+2.25=$66.68
From the above evaluation, the stock price on Thursday was $66.68
Correct Answer is D
Explanation
The median of a data set is a number that falls in the middle of the data set. To find the median, the numbers in the data set are arranged from the smallest to the largest. In the given data set, the organized arrangement is:
-5, -1, 0, 3, 9
There are five elements in the data set, and the median falls in the third position from either side. Thus, 0 falls in the third position.
Correct Answer is B
Explanation
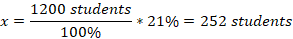
The number of cups of milk to make a bigger batch, we proceed as follows:
First convert the mixed number 1 2/5 as
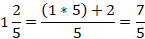
Then, we let the unknown number of cups of milk to be x and we set a proportion equation with number cups of floor as numerator and cups of milk as denominator
Find the value of x by cross-products

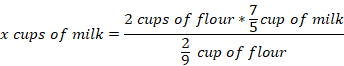
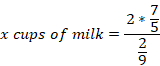
2 as a fraction is 2/1 which is then used to find the product of the numerator as follows.
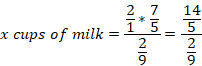
Per means division. The above equation becomes
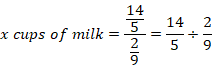
When dividing fractions, we multiply the first fraction with the reciprocal of the second. The reciprocal of 2/9 is 9/2. Thus
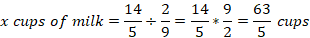
The numbers of cups of milk required is 63/5, which when converted to mixed fraction becomes 12 3/5.
Correct Answer is B
Explanation
Based on the given scenario, the outcome of measuring the daily dollar rate is the decline in investment, stock prices, and forex exchange. The three outcomes are dependent variables while the dollar rate is the independent variable.
Correct Answer is C
Explanation
We follow the order of operations to solve the given expression. The order of operations is PEMDAS:
- Parentheses
- Exponents
- Multiplication and Division (in order from left to right)
- Addition and Subtraction (in order from left to right)
First, we start with the numerator and solve it as follows
[3(6+5*4)]
We start with multiplication in parenthesis, 5*4=20. The expression becomes
[3(6+20)]
Then, we conduct the addition in parenthesis 6+20=26. Then, the expression becomes
[3(26)]=3*26=78
Now, we solve for denominator, which is 26/2=13.
Thus, the expression is reduced into
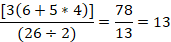
The expression reduces into 6.
This question was extracted from the actual TEAS Exam. Ace your TEAS exam with the actual TEAS 7 questions, Start your journey with us today
Visit Naxlex, the Most Trusted TEAS TEST Platform With Guaranteed Pass of 90%.
Money back guarantee if you use our service and fail the actual exam. Option of personalised live tutor on your area of weakness.