An athlete can run 6 miles in 51 minutes. At this rate, how many miles could the athlete run in 90 minutes?
15 miles
11.5 miles
45 miles
10.6 miles
Correct Answer : D
Here, the athlete runs 6 miles in 51 minutes, which can be expressed as:

Now, in 90 minutes, the athlete will cover about
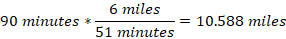
Therefore, the athlete runs about 10.6 miles in 90 minutes.
TEAS 7 Exam Quiz Bank
HESI A2 Exam Quiz Bank
Find More Questions 📚
Teas 7 Questions: We got the latest updated TEAS 7 questions
100% Money Refund: 100% money back guarantee if you take our full
assessment pass with 80% and fail the actual exam.
Live Tutoring: Fully customized live tutoring lessons.
Guaranteed A Grade: All students who use our services pass with 90%
guarantee.
Related Questions
Correct Answer is D
Explanation
We convert the given weight in pounds to ounces and find total weight. 1 pound=16 ounces, which we interpret as

Or

Use the second option to convert pounds to ounces

Now, we can ounces to ounces as: 48 oz + 5 oz= 53 oz
Therefore, 3 pounds, 5 ounces is equal to 53 oz
Correct Answer is A
Explanation
From the given problem,
49.5 pounds of fertilizer is needed to farm 1 acre of land. This can be interpreted as:

Or

Now we are needed to find the acres of land that will be farmed using 2000 pounds of fertilizers. To solve this, we use the second option as follows:

2000 pounds of fertilizers can farm approximately 40 acres of land.
Correct Answer is D
Explanation
Looking at the given trend, it is observed that the price increases with years. From 2008 to 2012, the price is fairly constant but we expect it to be more than $130,000 in the year 2016. The expected price in 2016 is $140,000.
Correct Answer is D
Explanation
The given ratio of yoghurt to toppings is 4:3, meaning:
Yoghurt : toppings =4 : 3
We are given 4.5 oz of toppings and need to find the amount of yoghurt.
Step 1: Set up the proportion
 =
= 
Step 2: Solve for yoghurt
Multiply both sides by 4.5:
yoghurt=43×4.5
yoghurt=4×4.5/3=18/3=6oz
Correct Answer is B
Explanation
In the simple interest, we utilize the following formula to find the simple interest after a period of time in years.
I=P*r*t
I is the interest
P=Principal or initial deposit
r=rate
t=time in years
From the given problem, P=$600, r=6%=6/100=0.06, t=5 years. Then
I=$600*0.06*5=$180
After 5 years, Pat will earn an interest of $180.
Correct Answer is C
Explanation
In this problem, to find one side of the square garden, we use the calculator to find the square root of 13. Thus
Thus, the approximate side of a square garden is about 3.6 ft
Correct Answer is C
Explanation
When dividing fractions, the division sign is changed into multiply sign and the first fraction is multiplied by the inverse of the second fraction.

Change division to multiply sign and find invers of 5/8. The inverse of a fraction is inverting the given fraction. The denominator becomes the numerator and the numerator becomes the denominator.

Correct Answer is B
Explanation
Here we are required to find the area of the square of sides 3.1 m. The square is a four-sided figure with each side equal and opposite sides making 90 degrees.

Area of the square =side*side
Side=3.1 m
Area of the square =3.1 m *3.1 m=9.61 m2
Note: 3.1 + 3.1 = 6.2 which is a wrong answer.
Correct Answer is D
Explanation
Percentages always add up to 100%. If we let x be the percent of graduates working for jobs unrelated to law, then
74%+3%+2%+x=100%
79%+x=100%
Subtract 79% from both sides of the equation
79%-79%+x=100%
x=100%-79%
x=21%
So, the number of graduates working for jobs unrelated to law is 21%.
Correct Answer is A
Explanation
From the given options, we can arrange the numbers from the smallest to the largest as:
-271.906, -193.823, 145.884, 235.971
From the above, it can be noted that -271 is less than -193 while 235 is more than 145.
This question was extracted from the actual TEAS Exam. Ace your TEAS exam with the actual TEAS 7 questions, Start your journey with us today
Visit Naxlex, the Most Trusted TEAS TEST Platform With Guaranteed Pass of 90%.
Money back guarantee if you use our service and fail the actual exam. Option of personalised live tutor on your area of weakness.