An athlete runs 5 miles in 25 minutes and then changes their pace to run the next 3 miles in 15 minutes. Overall, what is the average time in minutes it takes the athlete to run 1 mile?
7 minutes
5 minutes
6.5 minutes
8.5 minutes
Correct Answer : B
to find the average time the athlete runs in 1 mile, find total time divided by total distance covered in the two runs.
Total distance=5+3=8 miles
Total time=25+15=40 minutes
We now know that the athlete runs 8 miles in 40 minutes, so the time the athlete will run in 1 mile will be:
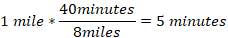
In 5 minutes, the athlete runs 1 mile.
TEAS 7 Exam Quiz Bank
HESI A2 Exam Quiz Bank
Find More Questions 📚
Teas 7 Questions: We got the latest updated TEAS 7 questions
100% Money Refund: 100% money back guarantee if you take our full
assessment pass with 80% and fail the actual exam.
Live Tutoring: Fully customized live tutoring lessons.
Guaranteed A Grade: All students who use our services pass with 90%
guarantee.
Related Questions
Correct Answer is D
Explanation
Here we need to find the actual values of the additions and see the trend the student will use to estimate the given problem. The exact sum is as follows
35+192=227
258+350=608
947+1032=1979
From the above calculations, it is evident that the student rounds up or down the ones place values. So, in the problem we need to approximate 694+7618.
694+7618=8312
We can approximate 8312 based on the provided choices is 8310.
Correct Answer is C
Explanation
In this problem, we need to find the amount of gratuity the couple will leave. The gratuity is 16% of the total bill. Before solving the problem, the following are terms and their meaning in percent problems:
- Is means equals
- Of means multiply
- What means unknown (variable)
If we let x be the amount of gratuity, then translating the given problem into a mathematical equation becomes:

So, the value of x=9.376 and to the nearest cent, x=9.38
There, a couple will leave a gratuity of $9.38.
Correct Answer is C
Explanation
We asked to convert kg to pounds. There are two ways of converting between kg and pounds

And

Since we are to find pounds, we use the second option for kg to cancel
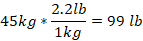
The pound equivalent of 45 kg is 99 lb.
Correct Answer is C
Explanation
We usea calculator to find the product of
1.6*0.93=1.488
Correct Answer is B
Explanation
: a ratio can be thought of a fraction of the form a/b, where b is not equal to zero. In ratio form, to means per.
Now, the class has 26 girls and 22 boys. Thus, the ratio of girls to boys becomes:

The fraction above reduces into
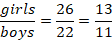
In ratio form, girls: boys=13:11
Thus, the ratio of girls to boys in a class of 48 students is 13 to 11.
Correct Answer is D
Explanation
The net income is the salary of the teacher gets after deducting total taxes.
Weekly net income=weekly gross income-total tax
Total tax=federal income tax+state income tax+Social Security tax
Total tax=$(72.00+35.00+65.00)
Total tax=$172.00
Weekly net income=$(730.00-172.00)=$558.00
The net income the teacher gets in 4 weeks is what she gets in one week multiplied by 4

The teacher will earn a net income of $2,232.00 in 4 weeks after taxes are deducted.
Correct Answer is B
Explanation
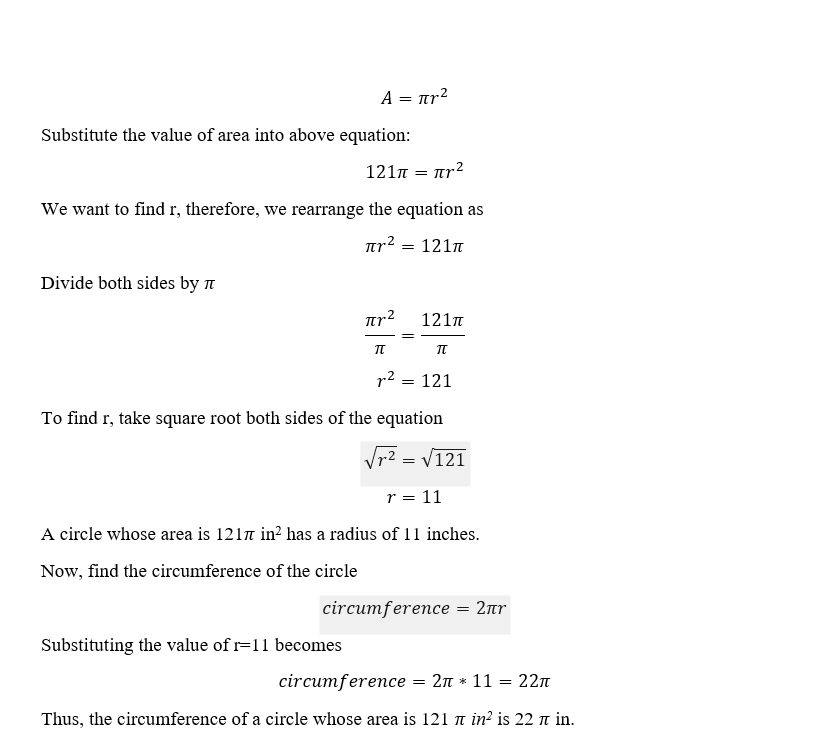
To solve this problem, first find the radius of the circle.
Correct Answer is D
Explanation
Let's calculate the number of each color of gumball:
- Red: 20% of 120 → 0.2×120=24
- Orange: 30% of 120 → 0.3×120=36
- Yellow: 5% of 120 → 0.05×120=6
- Green: 10% of 120 → 0.1×120=12
- Blue: The remaining percentage: 100%−(20%+30%+5%+10%) = 100%−65% =35%
- So, 0.35×120=42 blue gumballs.
Now, we find how many more blue gumballs there are than yellow:
42−6=36
Correct Answer is D
Explanation
: we are needed to find the portion of burger the two other friends share between themselves. A whole burger is 1, and we know that,
One friend=1/4 of 1=1/4*1=1/4
Remaining amount=1-1/4=4/4-1/4=3/4
Thus, ¾ of burger is left for two friends to share among themselves. Then, each friend will get
So, the other two friends will each get 3/8 of the burger.
Correct Answer is D
Explanation
The babies' measured weights change over time and depend on the time interval after birth. Since weight is the outcome being measured, it is the dependent variable in the study.
This question was extracted from the actual TEAS Exam. Ace your TEAS exam with the actual TEAS 7 questions, Start your journey with us today
Visit Naxlex, the Most Trusted TEAS TEST Platform With Guaranteed Pass of 90%.
Money back guarantee if you use our service and fail the actual exam. Option of personalised live tutor on your area of weakness.