
Four friends are sharing a pizza. One friend eats half of the pizza. The other three friends equally divide the rest among themselves. What portion of the pizza does each of the other three friends receive?
1/6
1/5
1/3
1/4
Correct Answer : A
A whole pizza is equivalent to 1. Then
One friend eats half of the pizza=1/2 of 1=1/2*1=1/2
Remaining amount of pizza to be shared=1-1/2=2/2-1/2=1/2
Now, three friends share ½ equally and each friend will get,
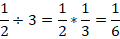
Thus, the three friends each share 1/6.
TEAS 7 Exam Quiz Bank
HESI A2 Exam Quiz Bank
Find More Questions 📚
Teas 7 Questions: We got the latest updated TEAS 7 questions
100% Money Refund: 100% money back guarantee if you take our full
assessment pass with 80% and fail the actual exam.
Live Tutoring: Fully customized live tutoring lessons.
Guaranteed A Grade: All students who use our services pass with 90%
guarantee.
Related Questions
Correct Answer is A
Explanation
From the given problem,
49.5 pounds of fertilizer is needed to farm 1 acre of land. This can be interpreted as:

Or

Now we are needed to find the acres of land that will be farmed using 2000 pounds of fertilizers. To solve this, we use the second option as follows:

2000 pounds of fertilizers can farm approximately 40 acres of land.
Correct Answer is C
Explanation
When dividing fractions, the division sign is changed into multiply sign and the first fraction is multiplied by the inverse of the second fraction.

Change division to multiply sign and find invers of 5/8. The inverse of a fraction is inverting the given fraction. The denominator becomes the numerator and the numerator becomes the denominator.

Correct Answer is B
Explanation
Here we are required to find the area of the square of sides 3.1 m. The square is a four-sided figure with each side equal and opposite sides making 90 degrees.
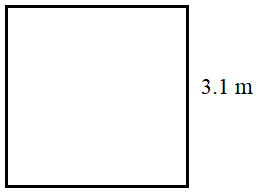
Area of the square =side*side
Side=3.1 m
Area of the square =3.1 m *3.1 m=9.61 m2
Note: 3.1 + 3.1 = 6.2 which is a wrong answer.
Correct Answer is A
Explanation
In this problem, we take the triangle as a right-angled triangle and label it as follows:
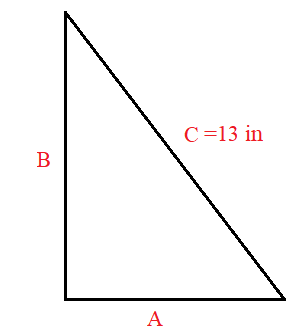
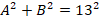
From the Pythagoras theorem A2 + B2= C2, we can look for a combination of A and B that when the squares of A and B are summed give a square of 13. Mathematically,

But C=13 inches
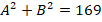
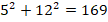
If we take A=5 inches and B=12 inches, then


Next, we take A=2.5 inches, B=6 inches



Next, we take A=2.5 inches, B=4 inches

6.25+16=169
22.25≠169
Taking A=5 inches and B=8 inches

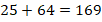

From the above computation, the combination of A=5 inches and B=12 inches give a triangle with a hypothenuse of 13 inches.
Correct Answer is B
Explanation
A dependent variable is one that when another variable changes, it also changes. In our case, the insurance premium changes if the age, model, mileage of car changes. Thus, insurance premium is the dependent variable while the other three are independent variable.
Correct Answer is B
Explanation
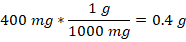
we are asked to change 400 mg to g. We use the conversion 1g=1000mg, which we can write as:

So, 400 mg to g becomes
Correct Answer is C
Explanation
We extrapolate the values of a line between 10 and 15 on y-axis to meet the curve and drop another line from the intersection of the curve to meet the x-axis and read off the age of the car.
Now, let’s extrapolate in the following diagram
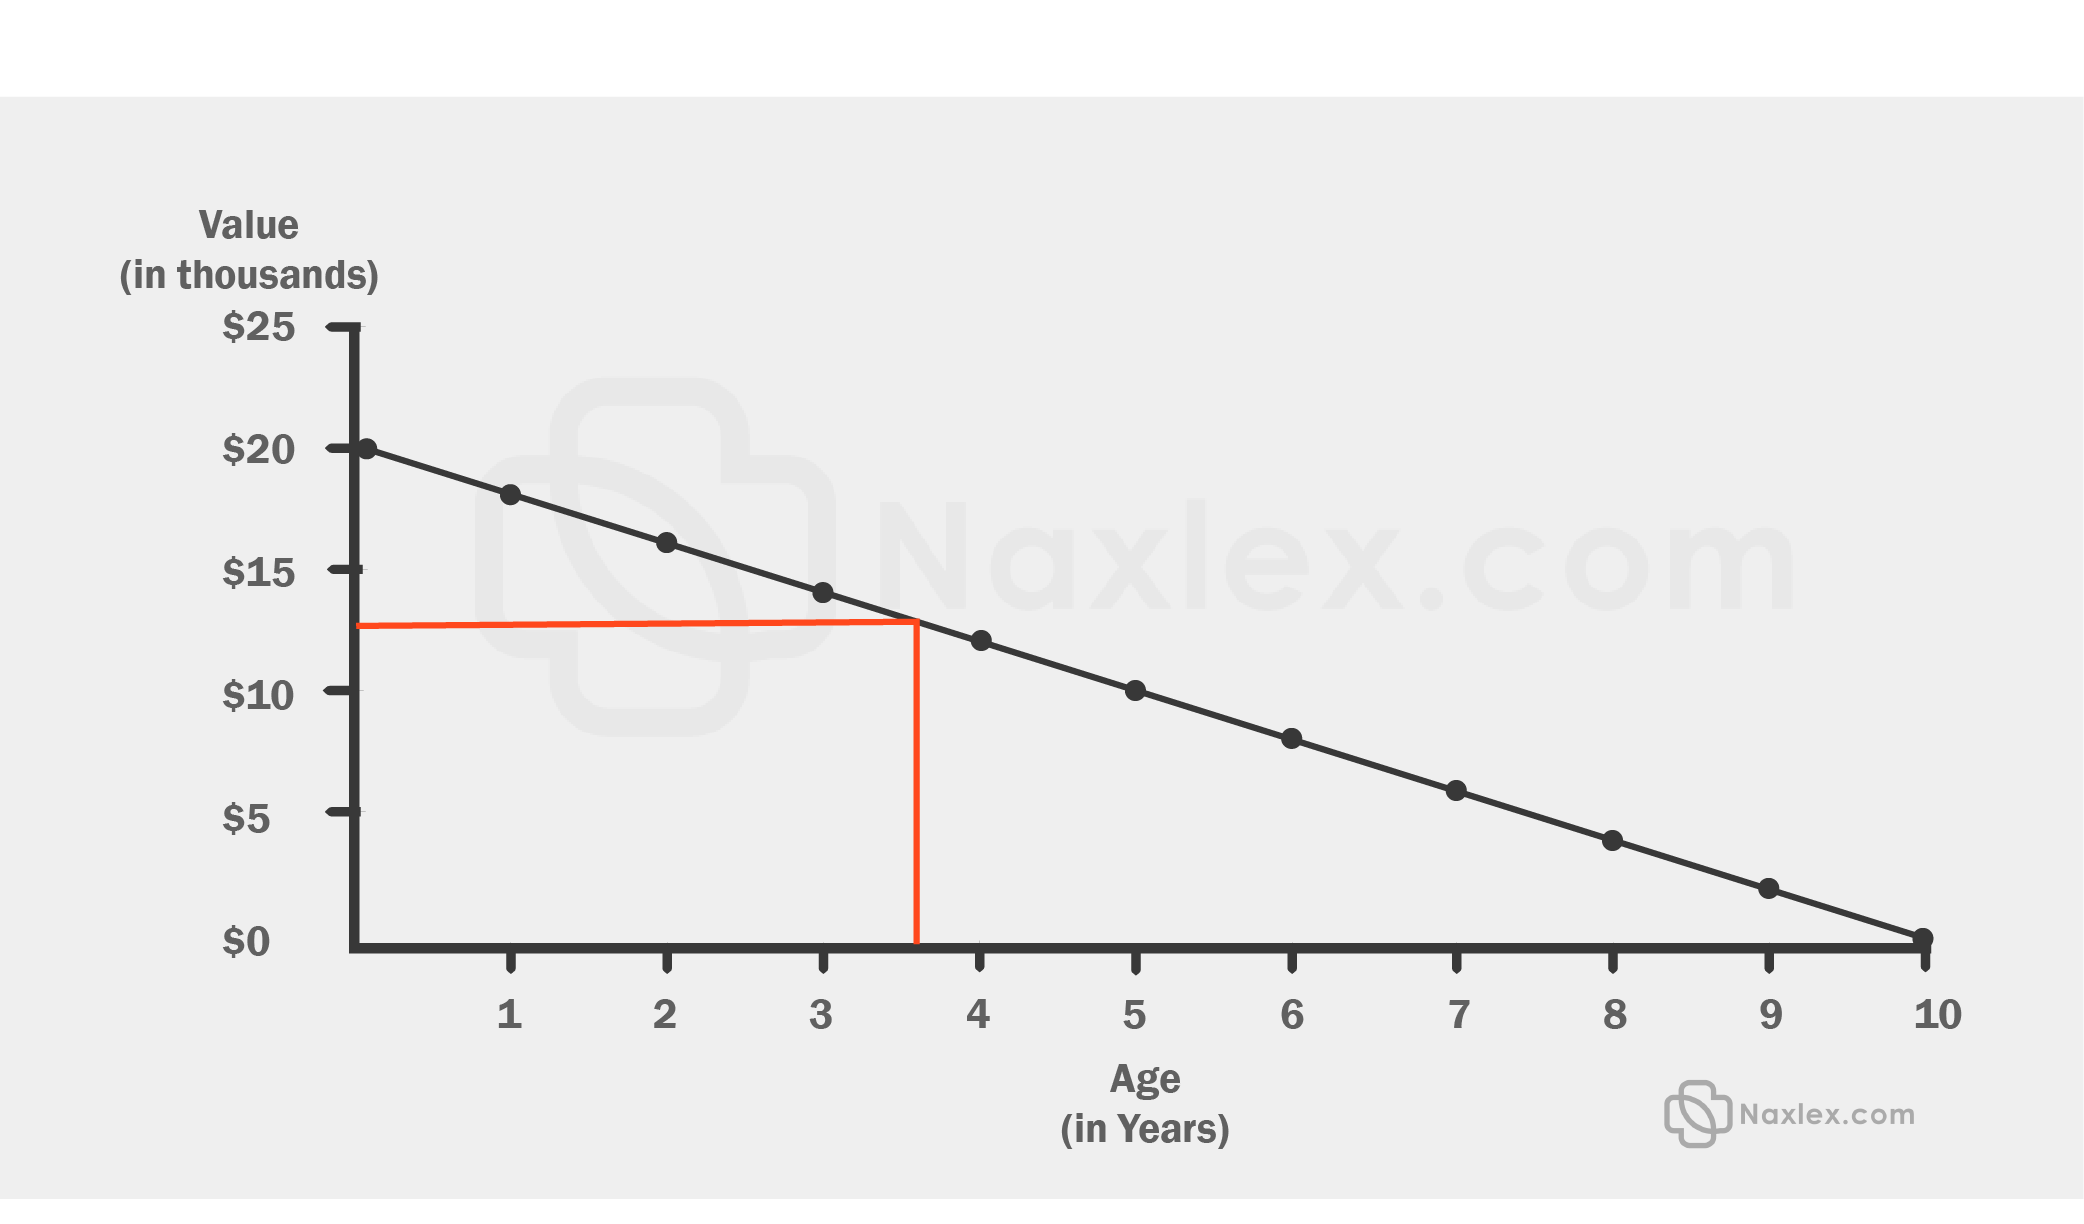
The intersection of the line and the x-axis is between 4 and 5 years. This means that the car is about 4.5 years old. From the options given, the age of the car is more than 3 years old.
Correct Answer is B
Explanation
from the provided table, the first option represents the amount of gas in gallons while the second column shows the distance in miles. Thus, (6, 144) will denote that the car can 144 miles by consuming 6 gallons of a gas.
Correct Answer is D
Explanation
We convert the given weight in pounds to ounces and find total weight. 1 pound=16 ounces, which we interpret as

Or

Use the second option to convert pounds to ounces
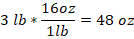
Now, we can ounces to ounces as: 48 oz + 5 oz= 53 oz
Therefore, 3 pounds, 5 ounces is equal to 53 oz
Correct Answer is B
Explanation
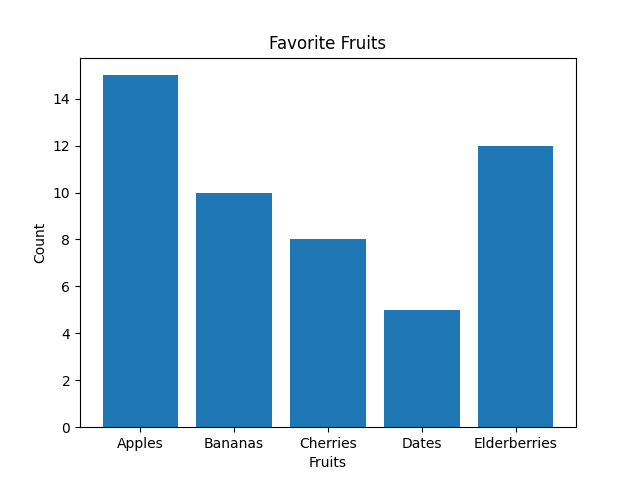
The best way to display the frequency of each day of the week when students get up after 8 a.m. is by using a bar graph. Bar graphs are well-suited for representing categorical data, where each day of the week is a separate category, and the height of each bar corresponds to the count or frequency of students waking up late on that specific day.
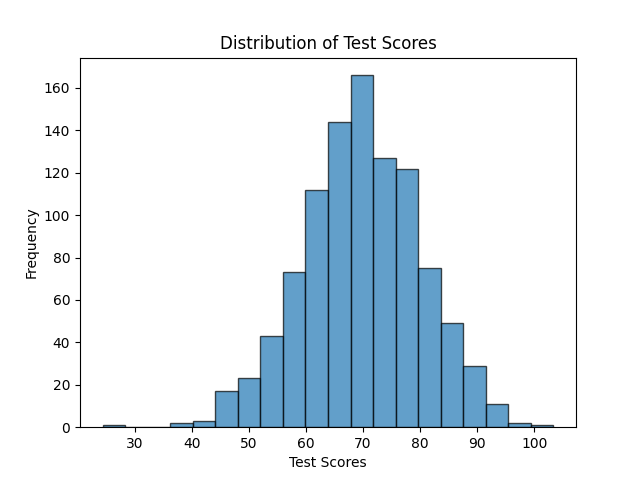
Note: Histograms, on the other hand, are more appropriate for visualizing continuous or numerical data and are not ideal for categorical data like days of the week.Histograms are useful for understanding the distribution of data, identifying patterns, and assessing the shape of the data distribution, such as whether it's normally distributed, skewed, or has multiple modes.
As you can see below, the Histogram is used to depict a pattern/continuous data. While a bar graph does just fine even with discrete data.
This question was extracted from the actual TEAS Exam. Ace your TEAS exam with the actual TEAS 7 questions, Start your journey with us today
Visit Naxlex, the Most Trusted TEAS TEST Platform With Guaranteed Pass of 90%.
Money back guarantee if you use our service and fail the actual exam. Option of personalised live tutor on your area of weakness.