How many milliliters are there in 0.5 liters?
5.000
50
500
5
Correct Answer : C
We use the relation 1 L=1000 mL to convert 0.5 L to mL as follows.
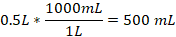
Thus, 0.5 L is 500 mL.
TEAS 7 Exam Quiz Bank
HESI A2 Exam Quiz Bank
Find More Questions 📚
Teas 7 Questions: We got the latest updated TEAS 7 questions
100% Money Refund: 100% money back guarantee if you take our full
assessment pass with 80% and fail the actual exam.
Live Tutoring: Fully customized live tutoring lessons.
Guaranteed A Grade: All students who use our services pass with 90%
guarantee.
Related Questions
Correct Answer is D
Explanation
We let x represent the amount of vanilla in mL, since this is what the question is asking us to find.
Next, we will set up a proportion with number of teaspoons on the numerator and amount in mL in the denominator.

Cross-multiply to find the value of x


A recipe of 2.5 teaspoons equals 12.325 mL.
Correct Answer is D
Explanation
To find the median, we arrange the following numbers in data set from the smallest to the largest as follows.
-3, -2, 0, 5, 10
From the above the data set, the median falls in the third position. Thus, 0 is the median for the given data set.
Correct Answer is C
Explanation
The question requires us to find the percentage change in weight of a person.
First, we need to find the change in weight over the 3 months
Change in weight= 180-160=20 lb
Percent change in weight is change of original weight *100. Thus
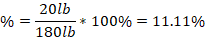
The percent change in weight is 11% to the nearest whole number.
Correct Answer is A
Explanation
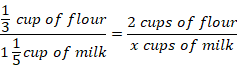
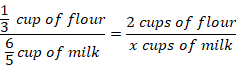
We are being asked to find the amount of milk needed. This is a proportion problem, which compares the amount of flour to that of milk. Letting x represent the amount of milk required, we set up the proportion with flour on the numerator and amount of milk in denominator as follows:
Change the mixed fraction of 1 1/5 into improper fraction as follows
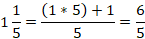
The proportion equation becomes
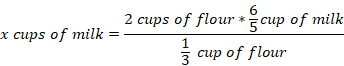
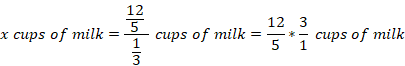
Cross-multiply to solve for x

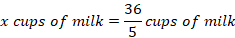
As an mixed fraction, 36/5 becomes 7 1/5. Therefore, 7 1/5 cups of milk are needed to make a big batch of 2 cups.
Correct Answer is B
Explanation
We need to find the value of x from the given equation. First, we move the value of 10 to the right-hand side of the equation.
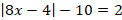
Add 10 to both sides of the equation
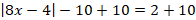

Next, we apply the absolute rule:
 , a>0, then u=a or u=-a
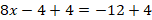
In this case a=12, which is greater 0. Then, the first condition becomes

Solving for x


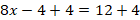
The second condition becomes

Solving for x


Then, the value of x is -1 or 2.
Correct Answer is C
Explanation
We use the relation 1 L=1000 mL to convert 0.5 L to mL as follows.
Thus, 0.5 L is 500 mL.
Correct Answer is A
Explanation
What fraction of the pizza the other three friends get is what is asked to find.
First, the pizza is whole, representing a value of 1. Then, one friend ate half of the pizza. Thun, the fraction of the pizza the friend gets is:
First friend eats =1/2 of 1=1/2
Remaining fraction of the pizza=1-1/2=1/2
Now, the three friends share ½ amongst themselves equally. Then, each friend gets
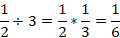
The three friends each gets 1/6 of the pizza.
Correct Answer is A
Explanation
To find the cost-effective option, we need to find how much the consumer will spend for the given options:
2 packs of Orange and 1 pack of Cream Soda will cost $18+$5= $23
3 Packs of Orange will cost $18+$10=$28
2 packs of Root Beer and 1 pack of Cream Soda will cost 2($12)+$5=$29
5 packs of cream Soda will cost 5($5)=$25
From the above evaluation, the consumer will spend $23 for a cost effective package of soft drinks. Thus, 2 packs of Orange and 1 pack of Cream Soda will be cheaper to purchase compared to other options.
Correct Answer is C
Explanation
We need to find the are of the rectangle from the given case. Letting x represent the width of the rectangle. Then, we can find the area of the rectangle as follows.
Length of rectangle=(x+5)
Width of the rectangle= x
Area of the rectangle, A= Length*width=(x+5)*x
A=x(x+5)
Thus, the area of the rectangle is x(x+5).
Correct Answer is A
Explanation
The mean of a data set is the total scores divided by the number of tests.
Total test scores =100+78+47+84+93+78=480
Number of tests =6
Mean test score =480/6=80
The mean test score is 80.
This question was extracted from the actual TEAS Exam. Ace your TEAS exam with the actual TEAS 7 questions, Start your journey with us today
Visit Naxlex, the Most Trusted TEAS TEST Platform With Guaranteed Pass of 90%.
Money back guarantee if you use our service and fail the actual exam. Option of personalised live tutor on your area of weakness.