If a box of 35 syringes costs $560.00, which of the following is the cost of two syringes?
$15.00
$16.00
$32.00
$8.00
Correct Answer : C
the question requires we find the cost of two syringes.
If we let x be the cost of two syringes, then we set up a proportion equation with cost as numerator and number of syringes as denominator. The proportion equation becomes

Cross-multiply to solve for x
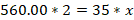

Rearranging the above

Divide both sides by 35


The cost of 2 syringes is $32.
TEAS 7 Exam Quiz Bank
HESI A2 Exam Quiz Bank
Find More Questions 📚
Teas 7 Questions: We got the latest updated TEAS 7 questions
100% Money Refund: 100% money back guarantee if you take our full
assessment pass with 80% and fail the actual exam.
Live Tutoring: Fully customized live tutoring lessons.
Guaranteed A Grade: All students who use our services pass with 90%
guarantee.
Related Questions
Correct Answer is C
Explanation
to find the average time the athlete runs in 1 mile, find total time divided by total distance covered.
Total distance=4+4=8 miles
Total time=28+32 =60 minutes
From the above, the athlete runs 8 miles in 60 minutes, so the athlete will take how minutes to cover 1 mile.
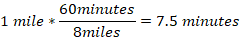
So, the athlete covers 1 mile in 7.5 minutes.
Correct Answer is D
Explanation
To form an equation from the word problem, first break the given statement into smaller statements.
First, we are given the width of the rectangle as x. We are told, the length is three times width. Mathematically, this means
Length=3*width=3*x=3x
Again, the length is 4 less than 3 times width of the rectangle. Thus, the length of rectangle in terms of width becomes:
Length =3x-4
This is the required equation.
Correct Answer is A
Explanation
we are needed to find the portion of pizza shared by 3 three friends. We treat the whole pizza as 1. Now, 1 friend eats half of the whole pizza. Thus,
One friend=1/2 of 1=1/2*1=1/2
Remaining amount=1-1/2=2/2-1/2=1/2
Thus, ½ of pizza is left for three friends to share among themselves. Then, each friend will get
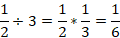
So, the other three friends will each get 1/6 of the pizza.
Correct Answer is A
Explanation
To find the least common denominator (LCD) of the fractions 1/2, 2/3, and 4/5, follow these steps:
Step 1: Identify the denominators
The denominators are 2, 3, and 5.
Step 2: Find the least common multiple (LCM)
The LCM of 2, 3, and 5 is the smallest number that all three denominators divide into evenly.
- Prime factorization:
- 2=2
- 3=3
- 5=5
Since 2, 3, and 5 are all prime numbers, their LCM is:
2×3×5=30
Correct Answer is C
Explanation
we need to find the net income of the nurse in 4 weeks from the weekly net income.
Weekly net income=gross income-total tax
Total tax=federal income tax+state income tax+Social Security tax
Total tax=$(83.00+38.00+79.00)
Total tax=$200.00
Weekly net income=$(800.00-200.00)=$600.00
In one week, the net income of the nurse is $600.00 and in 4 weeks the nurse will a net income of:
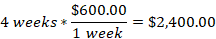
The nurse will earn $2,400.00 in 4 weeks after taxes are deducted.
Correct Answer is B
Explanation
in the given problem, we use the calculator to find 1.3*0.47=0.611
Correct Answer is C
Explanation
To solve this equation, we use a calculator and find the product as:
2.50*0.25=0.625
Correct Answer is D
Explanation
The first three months of the year are January, February, and March. We need to find the total rainfall for these three months from the provided graph.
In the month of January, rainfall is between o and 1, which is halfway. Therefore, rainfall in January is 0.5 inches
On February, rainfall was 1 inch and on March the rainfall was 2 inches. Thus,
Total rainfall = 0.5 inches + 1 inches + 2 inches = 3.5 inches
Correct Answer is C
Explanation
the question requires we find the cost of two syringes.
If we let x be the cost of two syringes, then we set up a proportion equation with cost as numerator and number of syringes as denominator. The proportion equation becomes
Cross-multiply to solve for x
Rearranging the above
Divide both sides by 35
The cost of 2 syringes is $32.
Correct Answer is D
Explanation
we need to form a mathematical expression from the given word problem.
Let the number be x.
Twice a number=2x
Five less than twice a number=2x-5
So the mathematical express from the word problem is 2x-5
This question was extracted from the actual TEAS Exam. Ace your TEAS exam with the actual TEAS 7 questions, Start your journey with us today
Visit Naxlex, the Most Trusted TEAS TEST Platform With Guaranteed Pass of 90%.
Money back guarantee if you use our service and fail the actual exam. Option of personalised live tutor on your area of weakness.