The data below represents students’ test scores. Which of the following is the median of the set data?
24, 35, 18, 19, 22, 35, 16, 12, 26, 12, 23
18
22
23
19
Correct Answer : B
The median of a data set is found in two ways:
For an odd data set, the median fall in the (N+1)/2 th position.
For an even data set, the median is the average of the element in the (N/2)th and (N+1)/2 th positions.
To find the median of the given data set, we need to arrange the elements from the smallest to the largest as follows:
12, 12, 16, 18, 19, 22, 23, 24, 26, 35, 35
There are 11 elements in the data set. 11 is an odd number and the median fall in the (N+1)/2 th position.
Median =(11+1)/2=12/2=6 th position.
From the organized data, the element in the 6th position is 22, which is the required median for the data set.
TEAS 7 Exam Quiz Bank
HESI A2 Exam Quiz Bank
Find More Questions 📚
Teas 7 Questions: We got the latest updated TEAS 7 questions
100% Money Refund: 100% money back guarantee if you take our full
assessment pass with 80% and fail the actual exam.
Live Tutoring: Fully customized live tutoring lessons.
Guaranteed A Grade: All students who use our services pass with 90%
guarantee.
Related Questions
Correct Answer is D
Explanation
We are required to find the percent equivalent of the given fraction.
We multiply 7/8 by 100 to convert it to percent. You convert fraction to percent.

Thus 7/8 is equal to 87.5%.
Correct Answer is C
Explanation
to find the average time the athlete runs in 1 mile; we find total distance and total time the athlete takes in running.
Total distance run by athlete=7+3=10 miles
Total time=45+15 =60 minutes
The athlete runs 10 miles in 60 minutes. For the athlete to cover 1 mile, he will run for a time less than 60 minutes. Thus, in 1 mile, the athlete takes:
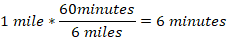
So, in 6 minutes, the athlete covers 1 mile.
Correct Answer is A
Explanation
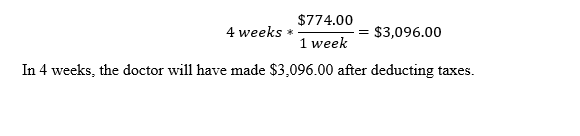
We are required to find the doctor’s earning in 4 weeks after taking off taxes.
The first step is to find the total weekly deductions as follows:
Total weekly tax=federal income tax + state income tax + Social Security tax
Total weekly tax=$(85.00+40.00+81.00)
Total tax=$206.00
The next step is to find the weekly income after deducting total taxes
Weekly net income=gross income-total tax
Weekly net income=$(980.00-206.00)=$774.00
In one week, the net income of the doctor is $774.00 and after 4 weeks, the net income will be 4 times his weekly earning
Correct Answer is D
Explanation
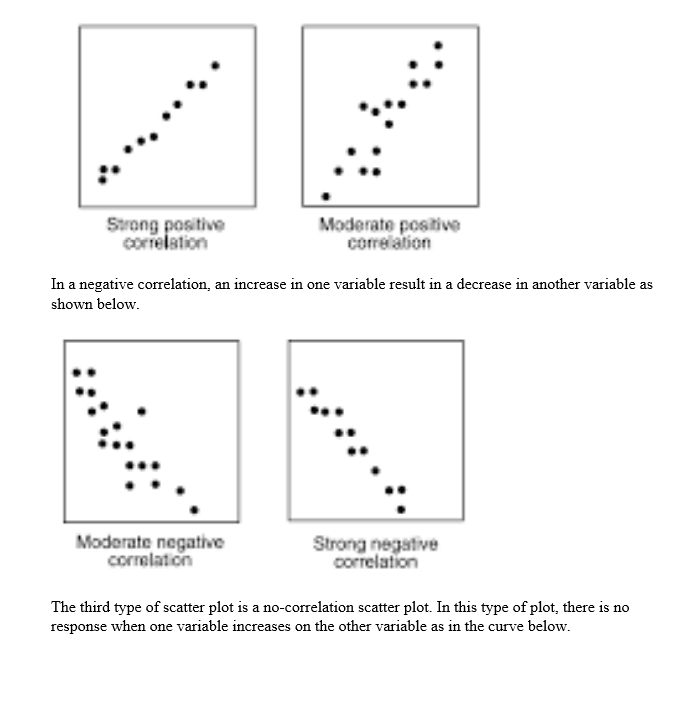
Scatter plots can depict three correlations: positive, negative and no correlation. A positive correlation scatter plot reveals that as one variable increases, the other variable also increases as shown below
Correct Answer is D
Explanation
We use the order of operation to solve for the unknown value of x.
3(3x+3)=8x+5
Multiply 3 with each number in the brackets
(3*3x)+(3*3)=8x+5
9x+9=8x+5
Subtract 9 from both sides
9x+9-9=8x+5-9
9x=8x-4
Subtract 8x on both sides
9x-8x=8x-8x-4
x=-4
Thus, the unknown value of x is -4.
Correct Answer is A
Explanation
An independent variable is a change that when modified brings a change in other variables. In this case, the person increases his climbing rate, calories burned, distance traveled and energy used increases. Therefore, the walking speed is the independent variable while other variables are dependent.
Correct Answer is A
Explanation
The first five months of the year are January, February, March, April, and May. We use to graph to find the amount of rainfall in each month as follows:
In the month of January, rainfall was between o and 1, which is halfway. Therefore, rainfall in January is 0.5 inches
On February, rainfall was 1 inch and on March the rainfall was 2 inches.
On April, the rainfall amount was 4 inches while on month of May, the rainfall was about 3.5 inches. Therefore, total rainfall in the first 5 months was:
Total rainfall=0.5 inches+1 inches+ 2 inches+4 inches + 3.5 inches =11 inches
Correct Answer is D
Explanation
In order for the teacher to better visualize the test performance for his class, he needs to present the mark distribution in chart form. A better chart visualizer is the histogram, which will show the frequency of marks against range of test scores. A bar graph will not be used because the rectangles need to touch one another.
In a bar graph, the rectangles do not touch each other. Therefore, it will not be a good chart visualizer.
Correct Answer is A
Explanation
The selling price of the sweater is marked price less the mark off value.
Mark off value=mark off rate*original price
Mark of value=30% of $95
Mark of value=0.30*$95=$28.50
Now, find the selling price of the sweater
Selling price= marked price-mark off value

Thus, the sweater will be sold for 66.50 after applying a mark off of 30%. The selling price is about $67.
Correct Answer is B
Explanation
The initial step is to convert the decimal numbers into fractions.
5.2 becomes 52/10
5.15 becomes 515/100
Next, find the least common denominator of 3, 10, and 100, which is 300. We use this value and multiply each fraction.
7/3*300=700
52/10*300=1560
13/3*300=1300
515/100*300=1545
From the above, 1560 is the greatest value which corresponds to 52/10. Thus, 5.2 is the greatest value of all the choices given.
This question was extracted from the actual TEAS Exam. Ace your TEAS exam with the actual TEAS 7 questions, Start your journey with us today
Visit Naxlex, the Most Trusted TEAS TEST Platform With Guaranteed Pass of 90%.
Money back guarantee if you use our service and fail the actual exam. Option of personalised live tutor on your area of weakness.