A teacher has asked all the students in the class which days of the week they get up after 9 a.m. which of the following is the best way to display the frequency for each day of the week?
Bar graph
Pie graph
Scatter plot
Histogram
Correct Answer : D
A histogram will be appropriate to represent the time the students wake up every day of the week. The histogram is used to represent the frequency of the variable with another variable. In our case the vertical axis will represent the number of students (frequency) while the time of waking up on the horizontal axis.
TEAS 7 Exam Quiz Bank
HESI A2 Exam Quiz Bank
Find More Questions 📚
Teas 7 Questions: We got the latest updated TEAS 7 questions
100% Money Refund: 100% money back guarantee if you take our full
assessment pass with 80% and fail the actual exam.
Live Tutoring: Fully customized live tutoring lessons.
Guaranteed A Grade: All students who use our services pass with 90%
guarantee.
Related Questions
Correct Answer is D
Explanation
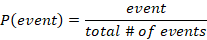
To find the probability of an event, we use the following the formula
To find the probability of drawing the red ball, we need to find the total number of balls in the bag.
Total number of balls in the bag=6+3+5=14 balls
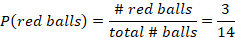
The probability of drawing a red ball from the bag is 3/14.
Correct Answer is A
Explanation
we use the relation 1 L=1000 mL and organize our equation in such a way that L cancels as:
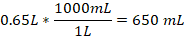
Thus, 0.65 L is 650 mL.
Correct Answer is D
Explanation
A histogram will be appropriate to represent the time the students wake up every day of the week. The histogram is used to represent the frequency of the variable with another variable. In our case the vertical axis will represent the number of students (frequency) while the time of waking up on the horizontal axis.
Correct Answer is D
Explanation
we are asked to find the number of gallons a full tank holds. A full tank is treated as 1 whole.
Letting x be the number of gallons in full tank and setting the proportion equation with the number of gallons on the numerator and fraction of tank on denominator as follows.
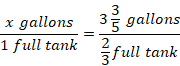
Convert the mixed fraction into proper fraction and cross-multiply to find the value of x.
x 1 full tank=185 gallons23full tank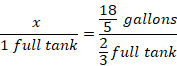
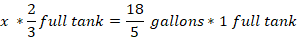
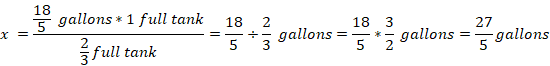
A full tank holds 27/5 gallons, which when converted to a mixed fraction is 5 2/5.
Correct Answer is A
Explanation
This problem asks us to compare the number of dimes to nickels.
If we let p be number of pennies in the bottle. Then,
Number of quarters in the bottle = 4p
Number of nickels in the bottle = 2p
Number of dimes in the bottle =7(2p)=14p
To find the number of dimes the child has than nickels, we use the ratio:
\(\frac{Dimes}{nickels} =\frac {14p}{2p}\ =\ 7\)
Thus, there are 7times as many dimes as nickels in the box.
Correct Answer is B
Explanation
we need to find the price of the stock on Thursday.
First, find the price changes in each day of the week as follows:
Monday’s price was $45.32
Tuesday’s price went up by $3.25 from Monday’s price. The price was $(45.32+3.25)=$48.57
Wednesday’s price decreased by $1.73 from Tuesday’s price, and so the price of the stock was $(48.57-1.73)=$46.84
Thursday’s price increased by $0.89 from Wednesday’s price, which was $(46.84+0.89)=$47.73
Therefore, the stock price on Thursday was $47.73.
Correct Answer is C
Explanation
We are asked to find the fraction of pizza the three friends shared equally.
First, the whole pizza is represented by 1. If one friend ate a quarter of the pizza, then:
First friend eats =1/4 of 1=1/4*1=1/4
Remaining fraction of the pizza=1-1/4=3/4
Now, the three friends share 3/4 amongst themselves equally. So, each friend gets
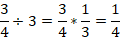
The three friends each gets 1/4 of the pizza.
Correct Answer is C
Explanation
We are asked to convert kg to pounds using the given relation. If we let x to represent the lb we are asked to find, we set the proportion equation with kg on numerator and lb on the denominator as follows.
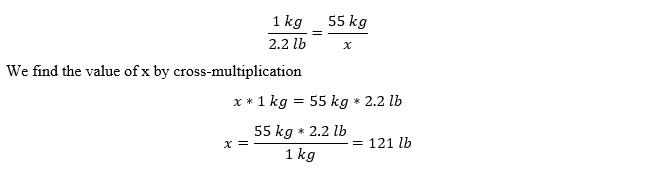
The equivalent value of 55kg is 121 lb.
Correct Answer is B
Explanation
By inspection, we find the corresponding values of the given denominations in the following manner.
Correct Answer is A
Explanation
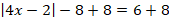
We are tasked to find the unknown values of x in the given equation.
First, we add 8 to both sides of the equation.

Next, we apply the absolute rule:
If  , a>0, then u=a or u=-a
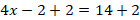
From our resulting equation, a=14, which is greater 0. Then, the first condition (u=a) becomes

Solving for x


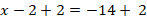
The second condition (u= -a) becomes

Solving for x


Thus, the value of x is 4 or -3
This question was extracted from the actual TEAS Exam. Ace your TEAS exam with the actual TEAS 7 questions, Start your journey with us today
Visit Naxlex, the Most Trusted TEAS TEST Platform With Guaranteed Pass of 90%.
Money back guarantee if you use our service and fail the actual exam. Option of personalised live tutor on your area of weakness.