The table below shows the student’s score at the end of the semester. Which of the following would best display the data?
|
Subject |
Math |
Chemistry |
Biology |
Physics |
English |
|
Test scores |
90 |
72 |
85 |
95 |
63 |
Stem and leaf plot
Line graph
Bar graph
Scatter plot
Correct Answer : C
The best way to visualize the student’s score for each subject is to plot them using a bar graph.
TEAS 7 Exam Quiz Bank
HESI A2 Exam Quiz Bank
Find More Questions 📚
Teas 7 Questions: We got the latest updated TEAS 7 questions
100% Money Refund: 100% money back guarantee if you take our full
assessment pass with 80% and fail the actual exam.
Live Tutoring: Fully customized live tutoring lessons.
Guaranteed A Grade: All students who use our services pass with 90%
guarantee.
Related Questions
Correct Answer is C
Explanation
We usea calculator to find the product of
1.6*0.93=1.488
Correct Answer is D
Explanation
The babies' measured weights change over time and depend on the time interval after birth. Since weight is the outcome being measured, it is the dependent variable in the study.
Correct Answer is D
Explanation
We need to find how many mL are in 5.5 teaspoons. We are told that 1 teaspoon is about 4.93 mL, which we interpret as follows:

Or

Since we are looking for mL, we use the second option.
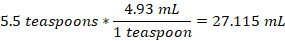
Thus, 5.5 teaspoons can hold approximately 27 mL.
Correct Answer is C
Explanation
The distribution of the weights of the newborn babies is symmetric meaning the mean, mode, and median are all equal. Thus, the bell-shape curve describes this kind of distribution of weights
Correct Answer is A
Explanation
To solve the equation this equation, we use a calculator and find the product as:
3.45 * 0.53= 1.8285
Correct Answer is A
Explanation
Correlation of two variables falls into:
Positive correlation: an increase in one variable causes another variable to increase
Negative correlation: an increase in one variable causes another one to decrease
No correlation: a change in one variable does not cause any response in another variable.
From the given choices
Option a is no correlation
Option b is a negative correlation
Option c is a negative correlation
Option d is a positive correlation
Thus, the correct statement is a.
Correct Answer is B
Explanation
We follow the order operations to solve for the unknown value of x.
3(2x+5)=11x+5
Open the bracket on the LHS by multiplying each term by 3
(3*2x)+(3*5)=11x+5
6x+15=11x+5
Subtract 15 from both sides
6x+15-15=11x+5-15
6x=11x-10
Subtract 11x on both sides
6x-11x=11x-11x-10
-5x=-10
Divide both sides by -5
-5x/-5=-10/-5
x= 2
Thus, the value of unknown value of x is 2.
Correct Answer is B
Explanation
Histograms are used to present frequency of data of one variable over the other. On the other hand, a bar graph is used to compare the two variables with the rectangles not touching one another as in histograms. Scatter plots are used to show the correlations between two variables. In this case, the teacher will be able to use scatter plot to establish the correlation between test scores and the subjects.
Correct Answer is C
Explanation
from the given data, one gallon of cleaning solution requires 6 oz of ammonia. The mathematical expression of this statement can be expressed in two ways:
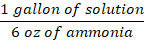
Or
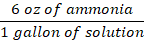
The question requires we find the amount of ammonia needed to make 230 gallons of the solution. So, we use the second option and proceed as follows:

From the above equation, gallon of solution will cancel, and oz of ammonia is left.
Therefore, the solution will require 1380 oz of ammonia.
Correct Answer is D
Explanation
From the given estimations, we can find the exact sum after adding the given numbers and see the trend the student utilizes to find their estimates. The actual sum is as follows
26+180= 206
206
115+391= 506
506
497+2024= 2521
2521
From the above evaluation, the students round the exact sum to the nearest tens. So, in the problem we need to approximate 545+7501.
545+7501=8046
The exact sum is 8046 and the approximate value after rounding to the nearest tens is 8050.
This question was extracted from the actual TEAS Exam. Ace your TEAS exam with the actual TEAS 7 questions, Start your journey with us today
Visit Naxlex, the Most Trusted TEAS TEST Platform With Guaranteed Pass of 90%.
Money back guarantee if you use our service and fail the actual exam. Option of personalised live tutor on your area of weakness.