There are 1200 students enrolled in four allied health programs at a local community college. The percent students in each program are displayed in the pie chart. Which of the following is the number of students enrolled in the radiologic technology program?

216
504
228
252
Correct Answer : D
We are asked to find the number of students enrolled in the radiologic program using the information provided on the pie chart.
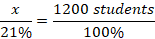
If we let x represent the number of students enrolled in the radiologic program, we set a proportion equation with number of students on the numerator and percentages on the denominator.
Total percent in the pie chart adds to 100%, which equals 1200 students. Then, 21% will represent
We solve the value of x by cross-multiplying the equation above.
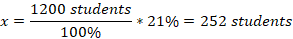
Therefore, 252 students will enroll for a radiologic program.
TEAS 7 Exam Quiz Bank
HESI A2 Exam Quiz Bank
Find More Questions 📚
Teas 7 Questions: We got the latest updated TEAS 7 questions
100% Money Refund: 100% money back guarantee if you take our full
assessment pass with 80% and fail the actual exam.
Live Tutoring: Fully customized live tutoring lessons.
Guaranteed A Grade: All students who use our services pass with 90%
guarantee.
Related Questions
Correct Answer is C
Explanation
The mean of a data set is the sum of all scores divided by the number of tests.
Total test scores = 83+86+76+88+97 = 430
Number of tests = 5
Mean test score = 430/5 = 86
The mean test score is 86.
Correct Answer is A
Explanation
we need to find the portion of pizza shared by other three friends.
Two friends eat half of the pizza, which is ½
And the remaining amount of pizza, 
Now, the other three friends share ½ amongst themselves equally. Then, each friend gets
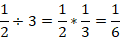
The other three friends each gets 1/6 of the pizza.
Correct Answer is C
Explanation
Here, we are required to find the unit of measuring mass. The SI unit of mass is kilogram but other derived units are grams, milligrams, microgram and more.
A kilogram is a large quantity for measuring heavier objects but grams can used to measure small and light objects such as the mass of the mobile phone. Therefore, gram is the appropriate unit for measuring weight of a mobile phone.
Correct Answer is D
Explanation
Given:
- 2 teaspoons of baking powder for every ½ cup of flour.
- We are using 5 cups of flour.
Step 1: Determine how many teaspoons are needed per cup of flour.
Since the recipe calls for 2 teaspoons for every ½ cup of flour, the number of teaspoons required for 1 full cup of flour would be:
2 teaspoons×2=4 teaspoonspercup.
Step 2: Calculate how many teaspoons are needed for 5 cups of flour.
Now, multiply the number of teaspoons needed for 1 cup of flour by 5:
4 teaspoonspercup×5 cups=20 teaspoons.
Thus, the number of teaspoons of baking powder needed for 5 cups of flour is 20 teaspoons.
Therefore, the correct answer is D. 20 tsp.
Correct Answer is D
Explanation
In this task, we use the relation from the given scenario to compare the number of dimes to quarters.
If we let p be number of pennies in the bottle. Then,
Number of quarters in the bottle = 2p
Number of nickels in the bottle = 3p
Number of dimes in the bottle =6(3p)=18p
Now relating dimes to quarters, we have
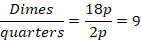
Thus, there are 9 times as many dimes as quarters in the box.
Correct Answer is D
Explanation
To find the area of the room, we form an equation of find an equation relating the length and width of the rectangle. If we let the width of the room to be w, then
Width of the rectangle= w
Length of rectangle=(w+5)
Area of the rectangle, A= Length*width=(w+5)*w
A=w(w+5)
Thus, the area of the rectangular room is w(w+5).
Correct Answer is B
Explanation
We use the calculator to find the positive square root of 19, which is then multiplied by 3.
Using the calculator, 
Multiplying the square root above with 3 becomes

The approximate value of 3 times the square root of 19 is 13.1.
Correct Answer is D
Explanation
The probability of finding a green ball is given by
Total number of balls in the bag=6+8+3=17 balls
Therefore, the probability of drawing a green ball from the bag containing 17 balls is 6/17.
Correct Answer is C
Explanation
The polling organization has an average ratio of 2 answered calls for every 15 attempted calls. To find the expected number of answered calls for 150 attempted calls, we can set up a proportion based on this ratio.
Step 1: Set up the proportion
The ratio of answered calls to attempted calls is:
 =
= 
Where x is the number of expected answered calls for 150 attempted calls.
Step 2: Solve for x
Cross-multiply to solve for x:
2×150=15×x
300=15x
X = 
x = 20
Conclusion:
The expected number of answered calls for 150 attempted calls is 20 calls.
The correct answer is C. 20 calls.
Correct Answer is C
Explanation
To convert millilitres (mL) to litres (L), we use the fact that:
1 L=1000 mL
So, to convert 2,500 mL to litres:
 =2.5 L
Thus, the patient needs 2.5 litres of saline.
The correct answer is C. 2.5 L.
This question was extracted from the actual TEAS Exam. Ace your TEAS exam with the actual TEAS 7 questions, Start your journey with us today
Visit Naxlex, the Most Trusted TEAS TEST Platform With Guaranteed Pass of 90%.
Money back guarantee if you use our service and fail the actual exam. Option of personalised live tutor on your area of weakness.