To determine the cost of a meal, the restaurant considers the quantity of the meal, the number of toppings, and the types of spices. Which of the following is the dependent variable?
Size of meal
Cost of meals
Type of spices
Number of toppings
Correct Answer : B
A dependent variable changes with any change made in an independent variable. From this case, cost of meals depends on other three options. In other words, the quantity of meal, number of toppings, and types of spices influence the cost of the meal.
TEAS 7 Exam Quiz Bank
HESI A2 Exam Quiz Bank
Find More Questions 📚
Teas 7 Questions: We got the latest updated TEAS 7 questions
100% Money Refund: 100% money back guarantee if you take our full
assessment pass with 80% and fail the actual exam.
Live Tutoring: Fully customized live tutoring lessons.
Guaranteed A Grade: All students who use our services pass with 90%
guarantee.
Related Questions
Correct Answer is D
Explanation
To find the required number of cups milk needed, we set a proportion equation with number of cups be numerator and cups of milk as denominator.
Let x be the number of cups of milk needed, then
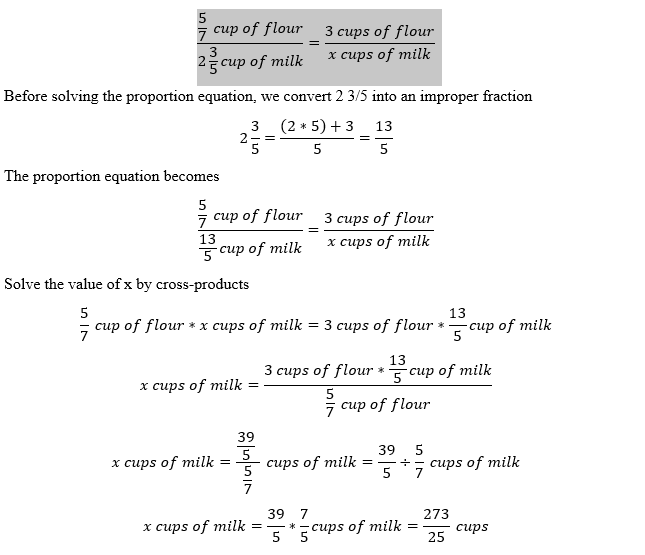
The numbers of cups of milk required is 273/25, which when converted to mixed fraction becomes 10 23/25.
Correct Answer is C
Explanation
A standard six-sided die has the numbers 1, 2, 3, 4, 5, and 6. The even numbers are 2, 4, and 6.
Step 1: Probability of rolling an even number on the first roll
There are 3 even numbers out of 6 total numbers, so:
P (evenonsecondroll) = 3/6 = ½
Step 2: Probability of rolling an even number on the second roll
Since rolling the die is an independent event, the probability remains:
P (evenonsecondroll) = 3/6 = ½
Step 3: Multiply the probabilities
P (evenonfirstANDevenonsecond) = ½ × ½ = ¼
Correct Answer is C
Explanation
we need to find the portion of pizza shared by two other friends.
We know that a whole pizza represents 1 and one friend eats half of it. So, the remaining amount left to other two friends is
Remaining fraction of the pizza=1-1/2=1/2
Now, the two friends share ½ amongst themselves equally. Then, each friend gets
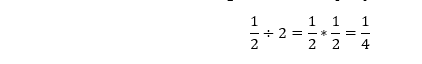
The two friends each gets 1/4 of the pizza.
Correct Answer is A
Explanation
To find the area of the room, we form an equation of find an equation relating the length and width of the rectangle. If we let the width of the room to be w, then
Width of the rectangle= w
Length of rectangle=(w+8)
Area of the rectangle, A= Length*width=(w+8)*w
A=w(w+8)
Thus, the area of the rectangular room is w(w+8).
Correct Answer is D
Explanation
The length of the door could be appropriately measured in meters. Kilometers are used to measure long distances while millimeters could be used to measure the length of very small objects. However, liters are used to measure the volume of liquids or objects.
Correct Answer is B
Explanation
To find the amount of vanilla in mL, we set up an equation in a way the unwanted units cancel out and leave the wanted unit we are looking for. Then,

Thus, a recipe of 6 teaspoons equals 29.58 mL.
Correct Answer is A
Explanation
To determine the correct coordinates of the point shown on the graph, follow these steps:
- Identify the x-coordinate: Count the number of units the point is to the right or left of the y-axis. The point is at 5 on the x-axis.
- Identify the y-coordinate: Count the number of units the point is above or below the x-axis. The point is at -8 on the y-axis.
- The correct coordinates are (5, -8).
Looking at the answer choices:
- A. (5, -8) → Correct
- B. (-5, 8) → Incorrect
- C. (-8, 5) → Incorrect
- D. (8, -5) → Incorrect
Final Answer:
A. (5, -8)
Correct Answer is D
Explanation
The circumference of a circle is given by the formula:
C=πd
where:
- d=16 inches
- π=3.14
Calculate the Circumference:
C=3.14×16 =50.24inches
Correct Answer is D
Explanation
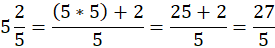
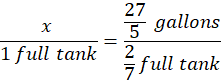
we are asked to find the number of gallons a full tank can hold. A full tank is equivalent to 1.
Convert the mixed fraction into proper fraction as follows
If we let x be the number of gallons in full tank, and setting up the proportion equation with the number of gallons on the numerator and fraction of tank on denominator as follows.
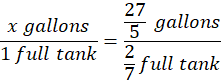
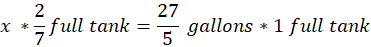
Cross-multiply to find the value of x.
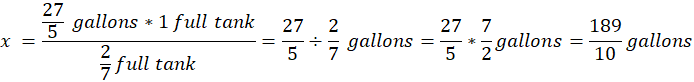
Converting 189/10 to a mixed fraction is 18 9/10. Thus, when the tank is full, it holds 18 9/10 gallons of water.
Correct Answer is B
Explanation
we convert the given value in yards to the cm by setting up the equation below.
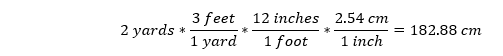
2 yards is equal to 182.88 cm, which is approximately 180 cm.
This question was extracted from the actual TEAS Exam. Ace your TEAS exam with the actual TEAS 7 questions, Start your journey with us today
Visit Naxlex, the Most Trusted TEAS TEST Platform With Guaranteed Pass of 90%.
Money back guarantee if you use our service and fail the actual exam. Option of personalised live tutor on your area of weakness.