When the marks of a science test are graphed, the distribution of markss is symmetric with the majority of weights centered around a single peak. Which of the following describes the shape of this distribution?
Uniform
Skewed right
Bell-shaped
Bimodal
Correct Answer : C
In a bell-shaped curve, the data distribution is symmetric around a single peak. The centering of data around a single peak means the mean, mode and median of the test are all equal to each other.
TEAS 7 Exam Quiz Bank
HESI A2 Exam Quiz Bank
Find More Questions 📚
Teas 7 Questions: We got the latest updated TEAS 7 questions
100% Money Refund: 100% money back guarantee if you take our full
assessment pass with 80% and fail the actual exam.
Live Tutoring: Fully customized live tutoring lessons.
Guaranteed A Grade: All students who use our services pass with 90%
guarantee.
Related Questions
Correct Answer is D
Explanation
Here we need to find the actual values of the additions and see the trend the student will use to estimate the given problem. The exact sum is as follows
35+192 227
227
258+350=608
947+1032=1979
From the above calculations, it is evident that the student rounds up or down the ones place values. So, in the problem we need to approximate 694+7618.
694+7618=8312
We can approximate 8312 based on the provided choices is 8310.
Correct Answer is D
Explanation
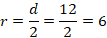
Before finding the area of the pizza, we need to find the radius of the pizza.
Find radius of the pizza in terms of diameter
Next, find area of the pizza using the radius of 6 inches

Substituting r=6 in the equation of the area of a circle
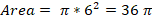
Thus, the pizza has an area of 36 π in2.
Correct Answer is B
Explanation
The initial step is to convert the decimal numbers into fractions.
5.2 becomes 52/10
5.15 becomes 515/100
Next, find the least common denominator of 3, 10, and 100, which is 300. We use this value and multiply each fraction.
7/3*300=700
52/10*300=1560
13/3*300=1300
515/100*300=1545
From the above, 1560 is the greatest value which corresponds to 52/10. Thus, 5.2 is the greatest value of all the choices given.
Correct Answer is C
Explanation
Let x be the original price of the recliner.
Step 1: Apply the 30% discount
The recliner is on sale for 30% less than the original price:
SalePrice=x−0.3x=0.7x
Step 2: Apply the 25% coupon discount
The consumer gets an additional 25% off the sale price:
FinalPrice=0.7x−0.25(0.7x) = 0.525x
Step 3: Solve for x
The consumer paid $237, so:
0.525x=237
x≈451.43x
Rounding to the nearest dollar, the original price is $451.
Correct Answer is A
Explanation
We analyze the given statement with the graph given as follows:
For option a: the points per game decreased five times between 1996 and 2015. So, the statement is true.
For option b: the lowest points scored per game was in 1998-99 season. So, the statement is false.
For option c: 2008-09 was the season the chargers scored the greatest number of points per game and not 2002-03 as claimed in the statement. So, this statement is not true.
Correct Answer is C
Explanation
From the given data, we can draw the following triangle by letting the unknown length to be p.
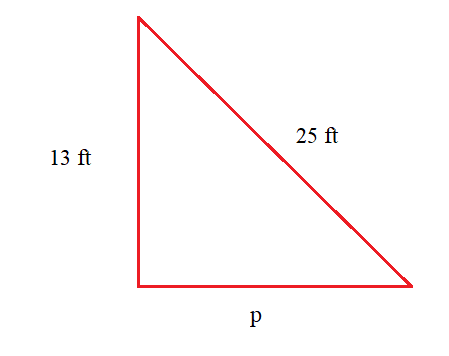
We apply the Pythagoras theorem, the value of p:
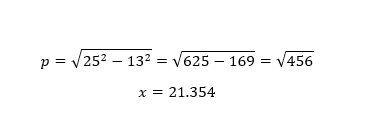
The unknown length of the triangle is about 21.4 feet.
Correct Answer is B
Explanation
We need to find the radius of the circle from the given value of area. Then, the radius of the circle will be used to find the circumference of the circle.
The first step is to find the radius, r of the circle as
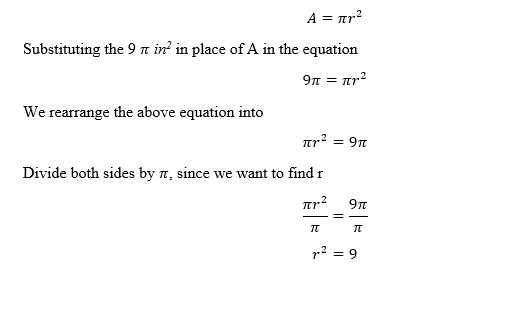
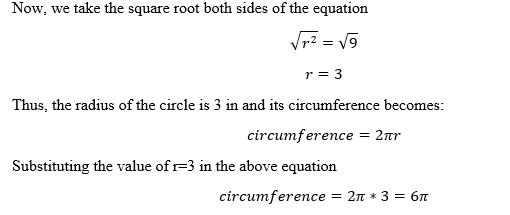
Thus, the circumference of a circle whose area is \(9\pi\ in\ ^2\)is 6  in.
in.
Correct Answer is B
Explanation
To solve this problem, we need to have all options in fraction form.
74  95 =
95 = 
7/8 = 3/8
0.72 = 72/100
74% = 74/100
Now, find the least common denominator of 95, 8, and 100. The least common denominator is 3800, which we multiply by each fraction as follows:
74/95*3800=2960
7/8*3800=3325
72/100*3800=2736
74/100*3800=2812
We can see that the fraction 7/8 is the greatest among the given options.
Correct Answer is D
Explanation
We use the order of operation to solve for the unknown value of x.
3(3x+3)=8x+5
Multiply 3 with each number in the brackets
(3*3x)+(3*3)=8x+5
9x+9=8x+5
Subtract 9 from both sides
9x+9-9=8x+5-9
9x=8x-4
Subtract 8x on both sides
9x-8x=8x-8x-4
x=-4
Thus, the unknown value of x is -4.
Correct Answer is D
Explanation
From the cost of 45 syringes, we are required to find the cost of 5 syringes. We set up a proportion equation by letting the cost of 5 syringes to y. Besides, we let the cost to be numerator and number of syringes to be denominator as follows.

Solve the value of y by cross products
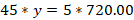
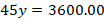
Divide both sides by 45
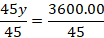

Therefore, 5 syringes will cost $80.00.
This question was extracted from the actual TEAS Exam. Ace your TEAS exam with the actual TEAS 7 questions, Start your journey with us today
Visit Naxlex, the Most Trusted TEAS TEST Platform With Guaranteed Pass of 90%.
Money back guarantee if you use our service and fail the actual exam. Option of personalised live tutor on your area of weakness.