Which of the following is the best approximation of 10 times the positive square root of 20?
100.0
44.7
200.0
89.4
Correct Answer : B
We use the calculator to determine the positive square root of 20, which is then multiplied by 20.
Using the calculator, 
Multiplying the square root above with 10 becomes
The approximate value is 44.7.
TEAS 7 Exam Quiz Bank
HESI A2 Exam Quiz Bank
Find More Questions 📚
Teas 7 Questions: We got the latest updated TEAS 7 questions
100% Money Refund: 100% money back guarantee if you take our full
assessment pass with 80% and fail the actual exam.
Live Tutoring: Fully customized live tutoring lessons.
Guaranteed A Grade: All students who use our services pass with 90%
guarantee.
Related Questions
Correct Answer is B
Explanation
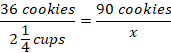
We are asked to find the number of cups of flour that will be used to make 90 cookies.
Letting x be the number of cups of flour and setting the proportion equation with number of cookies on numerator and number of cups of flour on the denominator. We have
Solve the value of x by cross-multiplying
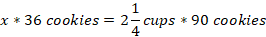
We convert the mixed fraction into improper fraction in order to carry out multiplication
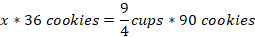
\(x =\ \frac{9}{4}\ cups\ *\ 90\ cookies\ *\ \frac{1}{36}\ cookies\)
The number of cups of flour needed to make 90 cookies is 5.625 cups, which is equal to 5 5/8 cups(Choice B).
Correct Answer is A
Explanation
To find the cost-effective option, we need to find how much the consumer will spend for the given options:
2 packs of Orange and 1 pack of Cream Soda will cost $18+$5= $23
3 Packs of Orange will cost $18+$10=$28
2 packs of Root Beer and 1 pack of Cream Soda will cost 2($12)+$5=$29
5 packs of cream Soda will cost 5($5)=$25
From the above evaluation, the consumer will spend $23 for a cost effective package of soft drinks. Thus, 2 packs of Orange and 1 pack of Cream Soda will be cheaper to purchase compared to other options.
Correct Answer is A
Explanation
7/25 is the same as 7÷ 25. The value becomes 0.28.
Thus, 0.28 is the decimal equivalent of 7/25.
Correct Answer is D
Explanation
The slope represent the ratio between the vertical height to the horizontal length. Let x be the minimum length of the ramp, we can set a proportion with height on the numerator and length on denominator. Then,

Cross-multiply to find the value of x
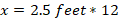

Thus, the minimum length of the ramp needed is 30 feet to access to a door that is 2.5 feet above the sidewalk.
Correct Answer is C
Explanation
We are asked to find the number of gallons full tank can hold. The fraction of full tank is 1.
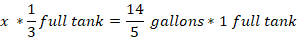
First, we let x be the number of gallons in full tank. Then, set the proportion equation by setting the number of gallons on the numerator and fraction of tank on denominator as follows.
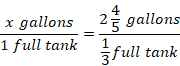
Convert the mixed fraction into proper fraction and cross-multiply to find the value of x.
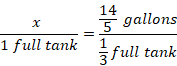
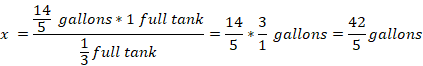
Converting 42/5 to a mixed fraction is 8 2/5. Thus, when the tank is full, it holds 8 2/5 gallons of water.
Correct Answer is C
Explanation
We are asked to find the one of the lengths of a right-angled triangle, we use the Pythagoras theorem to find the unknown length.
First, we label the triangle as below and let the unknown length be x.
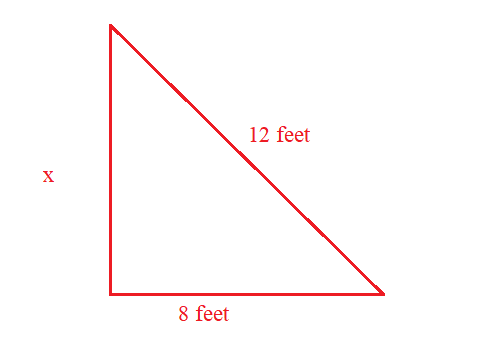
Then, we apply the Pythagoras theorem to find the value of x as:
\(a^2+b^2=c^2\)
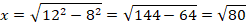

The value of the unknown length is approximately 8.9 feet.
Correct Answer is C
Explanation
An independent variable is a variable that is manipulated or changed in the experiment. From the given equation, t is an independent variable, which when changed changes the values of the f(t).
Correct Answer is C
Explanation
To calculate the percentage increase in client volume, use the formula:
PercentageIncrease ×100
×100
Step 1: Identify values
- Old Value (Year 1): 841 clients
- New Value (Year 2): 1,072 clients
Step 2: Compute the increase
1,072−841=231
Step 3: Calculate the percentage increase
 ×100 ≈ 27.47%
Step 4: Choose the closest answer
The closest option is 27%.
Correct Answer is C
Explanation
We required to find the units of finding the weight of a spoon. The mass is measured in kilogram and grams. Kilograms are used to measure the mass of heavier objects while grams for small and lighter objects.
Thus, gram is the appropriate unit for measuring weight of a spoon.
Correct Answer is C
Explanation
The question requires us to find the percentage change in weight of a person.
First, we need to find the change in weight over the 3 months
Change in weight= 180-160=20 lb
Percent change in weight is change of original weight *100. Thus
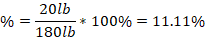
The percent change in weight is 11% to the nearest whole number.
This question was extracted from the actual TEAS Exam. Ace your TEAS exam with the actual TEAS 7 questions, Start your journey with us today
Visit Naxlex, the Most Trusted TEAS TEST Platform With Guaranteed Pass of 90%.
Money back guarantee if you use our service and fail the actual exam. Option of personalised live tutor on your area of weakness.