Which of the following is the best approximation of 5 times the positive square root of 29?
100.0
44.7
20.5
26.9
Correct Answer : D
we use the calculator to determine the positive square root of 20, which is then multiplied by 20.
Using the calculator,
Multiplying the square root above with 5 becomes

The approximate value is 26.9.
TEAS 7 Exam Quiz Bank
HESI A2 Exam Quiz Bank
Find More Questions 📚
Teas 7 Questions: We got the latest updated TEAS 7 questions
100% Money Refund: 100% money back guarantee if you take our full
assessment pass with 80% and fail the actual exam.
Live Tutoring: Fully customized live tutoring lessons.
Guaranteed A Grade: All students who use our services pass with 90%
guarantee.
Related Questions
Correct Answer is D
Explanation
9/26 is equivalent to 9÷26. The value becomes 0.3461538.
Thus, 0.35is the decimal equivalent of 9/26.
Correct Answer is D
Explanation
To round 24.375 kg to the nearest tenth (0.1 place), follow these steps:
- Identify the tenth place in 24.375:
- Tenth place: 3 (24.375)
- Hundredths place: 7 (the next digit after the hundredths place)
- Apply rounding rules:
- If the hundredths place is 5 or greater, round up the tenth place.
- Since 7 is in the hundredths place, round 24.3 up to 24.4.
Correct Answer is B
Explanation
we convert the given value in yards to the cm by setting up the equation below.
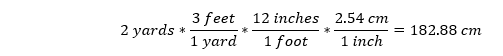
2 yards is equal to 182.88 cm, which is approximately 180 cm.
Correct Answer is D
Explanation
We are asked to make w the subject of the formula.
First, we rearrange the equation by to ensure w is on the right hand of the equation.
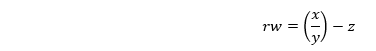
Then, divide both sides by r
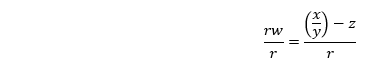
Multiply both sides by y
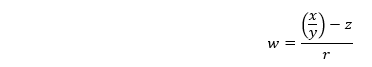
The above equation can be rearranged into
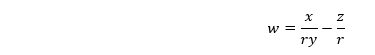
Thus, the formula for finding the value of w is (x/ry)-(z/r).
Correct Answer is A
Explanation
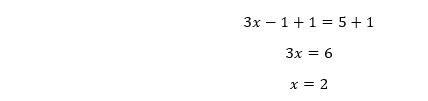
we find the value of x by applying the absolute conditions to the given equation.
First, add 2 to both sides of equation

Add 10 to both sides of the equation
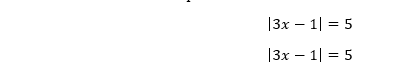
Next, we apply the absolute rule:
If u=a , a>0, then u=a or u=-a
In this case a=5, which is greater 0.
The first condition becomes
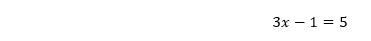
Solving for x
The second condition becomes

Solving for x
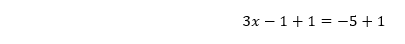

Then, the value of x is -4/3 or 2.
Correct Answer is A
Explanation
we are asked to find the number of cups of flour that will be used to make 130 cookies.
First, we convert 3 ¼ into improper fraction as:
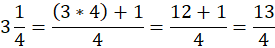
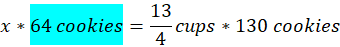
Letting x to be the number of cups of flour, we set up a proportion equation with number of cookies on numerator and number of cups of flour on the denominator becomes:
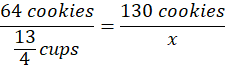
Solve the value of x by cross-products
Dividing both sides by 64, the above equation result to
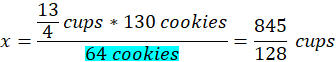
Thus, the number of cups of flour needed to make 130 cookies is 845/128 cups, which is equal to 6 77/128 cups.
Correct Answer is B
Explanation
To determine the number of sophomore students, follow these steps:
- Identify the total number of students:
1,276
- Identify the percentage of sophomores:
29%
- Calculate the number of sophomores:
(29%×1,276) = (29/100× 1,276) = 370.04
- Round to the nearest whole number:
370
Correct Answer is D
Explanation
To find the required number of cups milk needed, we set a proportion equation with number of cups be numerator and cups of milk as denominator.
Let x be the number of cups of milk needed, then
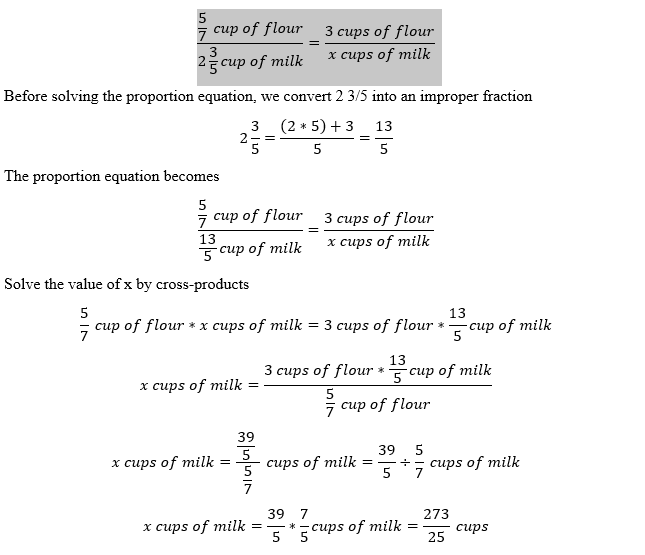
The numbers of cups of milk required is 273/25, which when converted to mixed fraction becomes 10 23/25.
Correct Answer is B
Explanation
we need determine the radius of the circle before we can find the circumference of the circle from the given area.
Let r be the radius of the circle, then

Substituting the value of area

Dividing both sides by pi and taking square root on both sides yields
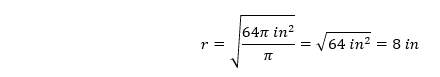
Now, the radius of the circle is 8 in. and the circumference of the circle is given by the relation:

Correct Answer is C
Explanation
we use the relation 1 L=1000 mL to convert 3.9 L to mL as follows.
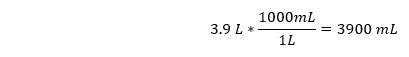
Thus, 3.9 L is 3900 mL.
This question was extracted from the actual TEAS Exam. Ace your TEAS exam with the actual TEAS 7 questions, Start your journey with us today
Visit Naxlex, the Most Trusted TEAS TEST Platform With Guaranteed Pass of 90%.
Money back guarantee if you use our service and fail the actual exam. Option of personalised live tutor on your area of weakness.