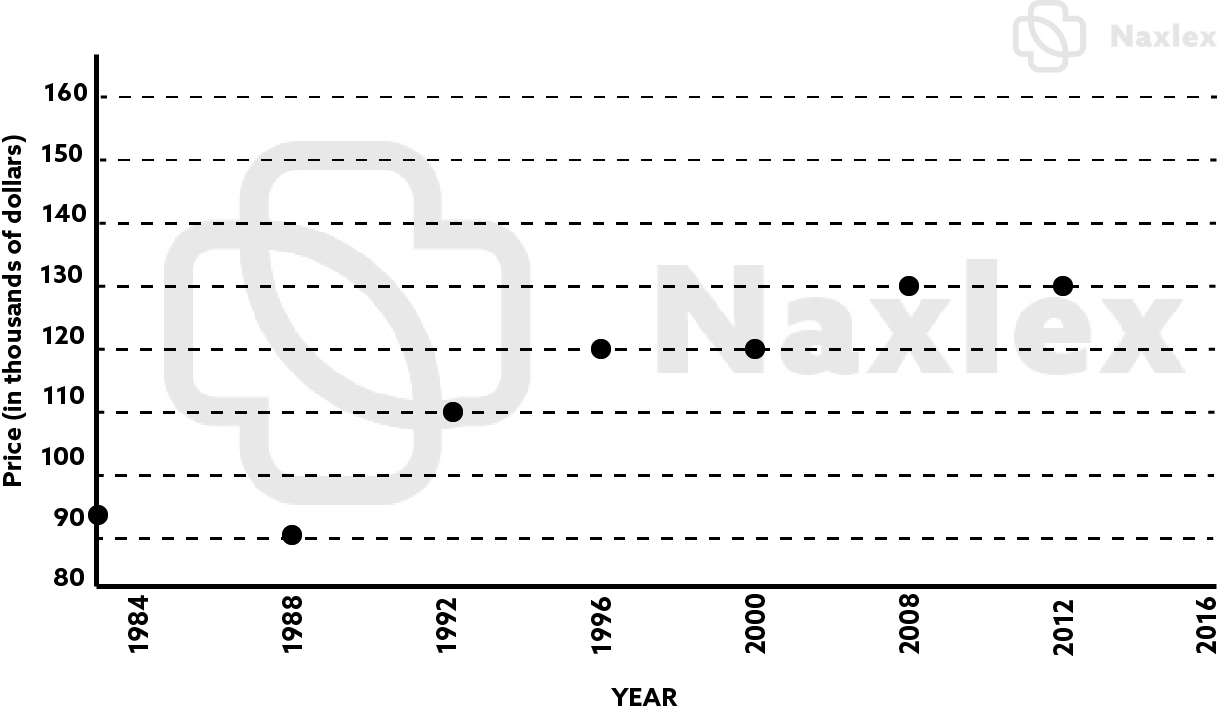
If the trend below continues, which of the following is the best estimate of the average price of a home in 2016?
$155,000
$120,000
$125,000
$140,000
Correct Answer : D
Looking at the given trend, it is observed that the price increases with years. From 2008 to 2012, the price is fairly constant but we expect it to be more than $130,000 in the year 2016. The expected price in 2016 is $140,000.
TEAS 7 Exam Quiz Bank
HESI A2 Exam Quiz Bank
Find More Questions 📚
Teas 7 Questions: We got the latest updated TEAS 7 questions
100% Money Refund: 100% money back guarantee if you take our full
assessment pass with 80% and fail the actual exam.
Live Tutoring: Fully customized live tutoring lessons.
Guaranteed A Grade: All students who use our services pass with 90%
guarantee.
Related Questions
Correct Answer is A
Explanation
In this problem, we take the triangle as a right-angled triangle and label it as follows:
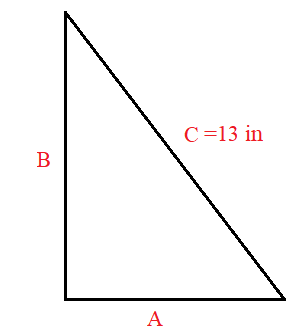
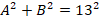
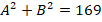
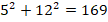
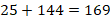
From the Pythagoras theorem A2 + B2= C2, we can look for a combination of A and B that when the squares of A and B are summed give a square of 13. Mathematically,

But C=13 inches
If we take A=5 inches and B=12 inches, then

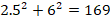
Next, we take A=2.5 inches, B=6 inches
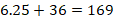

Next, we take A=2.5 inches, B=4 inches
6.25+16=169
22.25≠169
Taking A=5 inches and B=8 inches


From the above computation, the combination of A=5 inches and B=12 inches give a triangle with a hypothenuse of 13 inches.
Correct Answer is B
Explanation
The best way to display the frequency of each day of the week when students get up after 8 a.m. is by using a bar graph. Bar graphs are well-suited for representing categorical data, where each day of the week is a separate category, and the height of each bar corresponds to the count or frequency of students waking up late on that specific day.
Note: Histograms, on the other hand, are more appropriate for visualizing continuous or numerical data and are not ideal for categorical data like days of the week.Histograms are useful for understanding the distribution of data, identifying patterns, and assessing the shape of the data distribution, such as whether it's normally distributed, skewed, or has multiple modes.
As you can see below, the Histogram is used to depict a pattern/continuous data. While a bar graph does just fine even with discrete data.


Correct Answer is D
Explanation
We solve the problem by first finding the amount of gallons needed for the whole trip then find the cost of the gallon.
The car uses 1 gallon to cover 25 miles, which is same as:

Now, in 3000 miles, the car will use how many gallons of gasoline?
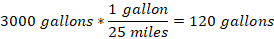
A trip of 3000 miles will need 120 gallons. And to find the cost of 120 gallons, we proceed as follows:
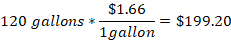
The family will spend $199.20 to drive for 3000 miles.
Correct Answer is B
Explanation
From the given scenario:
Initial charge is $40
Additional charge per circular cloth=$5c
Additional charge per rectangular cloth=$3.50r
Total cost = additional charge per circular rectangular cloths + Initial charge
Total cost, T = 5c + 3.5r + 40
Correct Answer is D
Explanation
We use the properties of exponent with the same base to solve for above expression.
Multiplication of exponents with same base, we add the exponents
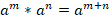
Division of exponents with same base, we subtract the exponents
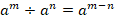
Using these two properties, we can solve the expression:
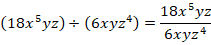
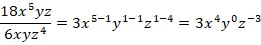
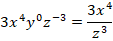
Now we use the following properties:
y0 =1, and , thus
Correct Answer is B
Explanation
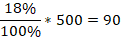
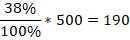
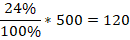
The whole pie chart represents 100%, which we use together with the given percentages to find the respective different sports. Note that 100% is equal to 500 surveyed students. The, the number of teenagers who prefer:
Soccer
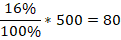
Hockey
Football
Basketball
Other
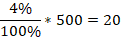
From the evaluations above, 90 teenagers love soccer, 80 love hockey, 190 teenagers love football, 120 teenagers love basketball, and 20 teenagers love others.
Correct Answer is A
Explanation
To find the net force, we choose east direction as positive and west as negative. From this, we can present the tag of war in the diagram below.
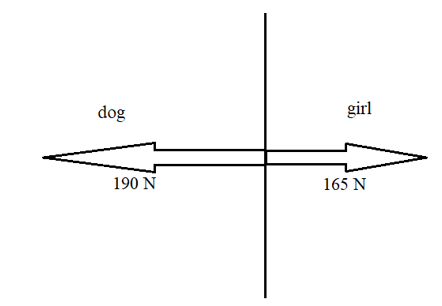
So, the force on the dog is -190 N and that of the girl is 165 N.
The net force is the sum of the two forces

The resulting force is negative, meaning it is in the west direction. Thus, the net force is 25 N to the west.
Correct Answer is B
Explanation
A dependent variable is one that when another variable changes, it also changes. In our case, the insurance premium changes if the age, model, mileage of car changes. Thus, insurance premium is the dependent variable while the other three are independent variable.
Correct Answer is A
Explanation
Let xxx be the amount the friend paid for their car. The problem states:
48,000=2x−2,000
Step 1: Solve for x
Add 2,000 to both sides:
48,000+2,000=2x
Divide by 2:
x=25,000
Correct Answer is D
Explanation
To answer this question, we need to observe the trend of the number of days with dollars. On day 2, the dollars were 8, after 5 days, the dollars decreased to 3, after 13 days, the dollars increased to 10. After 14 days, the dollars declined to 6 and again rose to 16 dollars after 19 days.
From this observation, we cannot be able to establishany correlation between days and dollars.
This question was extracted from the actual TEAS Exam. Ace your TEAS exam with the actual TEAS 7 questions, Start your journey with us today
Visit Naxlex, the Most Trusted TEAS TEST Platform With Guaranteed Pass of 90%.
Money back guarantee if you use our service and fail the actual exam. Option of personalised live tutor on your area of weakness.