Which of the following is the best estimate of the number of centimeters (cm) in 9 yards? (Note: 1 yard=3 feet; 1 foot =12 inches; 1 inch =2.54 cm)
775 cm
780 cm
823 cm
830 cm
Correct Answer : C
Here we utilize the dimensional analysis of units of measurement of length to convert yards to cm as follows
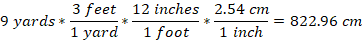
9 yards is equal to 822.96 cm, which is about 823 cm.
TEAS 7 Exam Quiz Bank
HESI A2 Exam Quiz Bank
Find More Questions 📚
Teas 7 Questions: We got the latest updated TEAS 7 questions
100% Money Refund: 100% money back guarantee if you take our full
assessment pass with 80% and fail the actual exam.
Live Tutoring: Fully customized live tutoring lessons.
Guaranteed A Grade: All students who use our services pass with 90%
guarantee.
Related Questions
Correct Answer is C
Explanation
To find the pounds equivalent of the kg given, we use the two options as given below.

OR

Since we want to remain with pounds, we use the second option and set up the equation below.
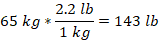
Thus, 65 kg is equal to 143 lb.
Correct Answer is D
Explanation
In this task, we use the relation from the given scenario to compare the number of dimes to quarters.
If we let p be number of pennies in the bottle. Then,
Number of quarters in the bottle = 2p
Number of nickels in the bottle = 3p
Number of dimes in the bottle =6(3p)=18p
Now relating dimes to quarters, we have
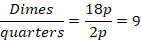
Thus, there are 9 times as many dimes as quarters in the box.
Correct Answer is C
Explanation
C organizes the collection correctly.
Correct Answer is A
Explanation
A. A=w(2w+1)
Explanation
The area of a rectangle is given by the formula:
A=length×width
Given that the length is one more than twice the width, we can express it as:
Length=2w+1
The width is simply w.
Now, substituting these into the area formula:
A=w(2w+1)
Thus, the correct answer is:
A=w(2w+1)
Correct Answer is D
Explanation
We use the given slope to find the minimum length of the ramp. In this case, slope is the ratio of height to length of the lamp. Thus,
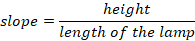
If we let x be the minimum length of the ramp. Then,
Substituting the value of slope into the above equation results in,

Solve for value of x by cross-products
X = 18 Feet
Thus, the minimum length of the ramp needed to provide access to a door that is 1.5 high is 18 feet.
Correct Answer is C
Explanation
Here, we are required to find the unit of measuring mass. The SI unit of mass is kilogram but other derived units are grams, milligrams, microgram and more.
A kilogram is a large quantity for measuring heavier objects but grams can used to measure small and light objects such as the mass of the mobile phone. Therefore, gram is the appropriate unit for measuring weight of a mobile phone.
Correct Answer is B
Explanation
A histogram is used to visualize the frequency of a one variable over the other while a line graph is used to compare two variables.
A scatter plot used to show the correlation between two variables.
A pie chart is used to show the proportion of the given information in circle, with each section of a circle representing a given fraction of a whole.
From the given information, a pie chart is an appropriate tool show the frequency of the students choosing their favorite color.
Correct Answer is D
Explanation
The median of a data set is a number that falls in the middle of the data set. To find the median, the numbers in the data set are arranged from the smallest to the largest. In the given data set, the organized arrangement is:
-5, -1, 0, 3, 9
There are five elements in the data set, and the median falls in the third position from either side. Thus, 0 falls in the third position.
Correct Answer is B
Explanation
Based on the given scenario, the outcome of measuring the daily dollar rate is the decline in investment, stock prices, and forex exchange. The three outcomes are dependent variables while the dollar rate is the independent variable.
Correct Answer is A
Explanation
The length of the chair could be appropriately measured in centimeters. Kilometers are used to measure long distances while micrometers could be used to measure the length of small microorganism in microbiology lab. However, milligrams are used to measure the masses of small quantities.
This question was extracted from the actual TEAS Exam. Ace your TEAS exam with the actual TEAS 7 questions, Start your journey with us today
Visit Naxlex, the Most Trusted TEAS TEST Platform With Guaranteed Pass of 90%.
Money back guarantee if you use our service and fail the actual exam. Option of personalised live tutor on your area of weakness.