Which of the following is the decimal equivalent of 9/26?
0.28
3.6
3.86
0.35
Correct Answer : D
9/26 is equivalent to 9÷26. The value becomes 0.3461538.
Thus, 0.35 is the decimal equivalent of 9/26.
TEAS 7 Exam Quiz Bank
HESI A2 Exam Quiz Bank
Find More Questions 📚
Teas 7 Questions: We got the latest updated TEAS 7 questions
100% Money Refund: 100% money back guarantee if you take our full
assessment pass with 80% and fail the actual exam.
Live Tutoring: Fully customized live tutoring lessons.
Guaranteed A Grade: All students who use our services pass with 90%
guarantee.
Related Questions
Correct Answer is A
Explanation
percentages are fractions with denominator equal to 100. To get the decimal form of the percent given, e divide the value by 100.
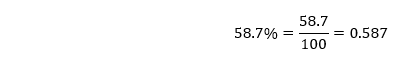
The decimal form of 58.7% is 0.587.
Correct Answer is D
Explanation
9/26 is equivalent to 9÷26. The value becomes 0.3461538.
Thus, 0.35is the decimal equivalent of 9/26.
Correct Answer is D
Explanation
The initial step is to convert the decimal options to fractions. Then, we find the LCM of the denominators of all fractions, which will be used to compare the values of the given options.
-0. becomes -9/10
-1.7 becomes -17/10
Then, the resulting denominators are 9, 10, and 63. Their LCM of 630 is used to multiply each fraction.
-2/9*630=-140
-9/10*630=-567
-17/10*630=-1071
-4/7*630=-360
From the calculations above, -140 is the greatest value of all the values. Thus, -2/9 is the greatest number.
Correct Answer is B
Explanation
we need determine the radius of the circle before we can find the circumference of the circle from the given area.
Let r be the radius of the circle, then

Substituting the value of area

Dividing both sides by pi and taking square root on both sides yields
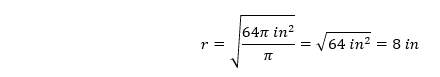
Now, the radius of the circle is 8 in. and the circumference of the circle is given by the relation:

Correct Answer is B
Explanation
The median of a data set is determined by arranging the numbers in ascending orders, and the median is the number the falls in the middle position.
-7, -4, 1, 3, 9
There are five numbers in the data set, and the median falls in the third position from either side. Thus, 1 fall in the third position.
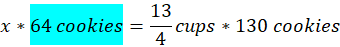
Correct Answer is A
Explanation
we are asked to find the number of cups of flour that will be used to make 130 cookies.
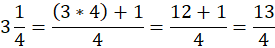
First, we convert 3 ¼ into improper fraction as:
Letting x to be the number of cups of flour, we set up a proportion equation with number of cookies on numerator and number of cups of flour on the denominator becomes:
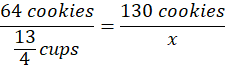
Solve the value of x by cross-products
Dividing both sides by 64, the above equation result to
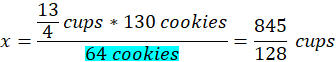
Thus, the number of cups of flour needed to make 130 cookies is 845/128 cups, which is equal to 6 77/128 cups.
Correct Answer is D
Explanation
To find the greatest number from the given options, convert the decimal numbers into fractions.
6.25 becomes 625/100
7.4 becomes 74/10
The LCM for the denominators of 8, 100, 7, and 10 is 2800. Now we can multiply each fraction with the LCM.
3/8*2800=1050
625/100*2800=17500
10/7*2800=4000
74/10*2800=20720
The fraction 7.4is the greatest of all.
Correct Answer is A
Explanation
The perimeter of a shape is the sum of the lengths of all its sides.
Given Trapezoid:
- Top side: 10 cm
- Bottom side: 16 cm
- Left slant side: 5 cm
- Right slant side: 5 cm
Calculate the Perimeter:
10+16+5+5=36cm
Correct Answer is D
Explanation
The length of the door could be appropriately measured in meters. Kilometers are used to measure long distances while millimeters could be used to measure the length of very small objects. However, liters are used to measure the volume of liquids or objects.
Correct Answer is A
Explanation
A histogram depicts the frequency of a one variable over the other while a bar graph is used to compare two variables with vertical axis representing the heights. Therefore, a histogram will be used to represent percent of the number of students reading after 9.
This question was extracted from the actual TEAS Exam. Ace your TEAS exam with the actual TEAS 7 questions, Start your journey with us today
Visit Naxlex, the Most Trusted TEAS TEST Platform With Guaranteed Pass of 90%.
Money back guarantee if you use our service and fail the actual exam. Option of personalised live tutor on your area of weakness.