Which of the following is the median of the date set below?
3, -5, 9, -1, 0
9
-5
-1
0
Correct Answer : D
The median of a data set is a number that falls in the middle of the data set. To find the median, the numbers in the data set are arranged from the smallest to the largest. In the given data set, the organized arrangement is:
-5, -1, 0, 3, 9
There are five elements in the data set, and the median falls in the third position from either side. Thus, 0 falls in the third position.
TEAS 7 Exam Quiz Bank
HESI A2 Exam Quiz Bank
Find More Questions 📚
Teas 7 Questions: We got the latest updated TEAS 7 questions
100% Money Refund: 100% money back guarantee if you take our full
assessment pass with 80% and fail the actual exam.
Live Tutoring: Fully customized live tutoring lessons.
Guaranteed A Grade: All students who use our services pass with 90%
guarantee.
Related Questions
Correct Answer is C
Explanation
C organizes the collection correctly.
Correct Answer is D
Explanation
We use the relation 1 L=1000 mL to convert L to mL.
The two options for converting between L and mL are

And

We use the first option to convert 6.5 L to mL as follows:
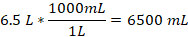
Thus, 6.5 L is 6500 mL.
Correct Answer is D
Explanation
Given:
- 2 teaspoons of baking powder for every ½ cup of flour.
- We are using 5 cups of flour.
Step 1: Determine how many teaspoons are needed per cup of flour.
Since the recipe calls for 2 teaspoons for every ½ cup of flour, the number of teaspoons required for 1 full cup of flour would be:
2 teaspoons×2=4 teaspoonspercup.
Step 2: Calculate how many teaspoons are needed for 5 cups of flour.
Now, multiply the number of teaspoons needed for 1 cup of flour by 5:
4 teaspoonspercup×5 cups=20 teaspoons.
Thus, the number of teaspoons of baking powder needed for 5 cups of flour is 20 teaspoons.
Therefore, the correct answer is D. 20 tsp.
Correct Answer is B
Explanation
The percentage change in weight is found in three steps below:
Absolute change in weight=final weight-initial weight
Absolute change in weight=(left|120-153 ight|=left|-33 ight|=33)
Relative change in weight=(frac{absolute change}{initial weight}=frac{33}{153}=0.216)
Percent change=relative change * 100%
Percent change=0.216*100%=21.6%
The percent change in weight lost is 21.6 %, which is about 22%.
Correct Answer is B
Explanation
Before finding the greatest number from the data set, the numbers need to be in fraction form.
-0.5=-5/10
-1.5=-15/10
The set of numbers becomes -2/3, -5/10, -15/10, -4/9
Now the least common denominator for 3, 10, and 9 is 90, which will be used to multiplied by the given fractions as follows:
-2/3*90=-60
-5/10*90=-45
-15/10*90=-135
-4/9*90=-40
From the above evaluations, the resulting numbers arranged from the smallest to the largest is -135, -60, -45, -40. Thus, the greatest number from the data set is -40, with a corresponding fraction of -4/9.
Correct Answer is A
Explanation
we need to find the portion of pizza shared by other three friends.
Two friends eat half of the pizza, which is ½
And the remaining amount of pizza, 
Now, the other three friends share ½ amongst themselves equally. Then, each friend gets
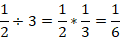
The other three friends each gets 1/6 of the pizza.
Correct Answer is D
Explanation
To find the greatest number from the given options, convert the decimal numbers into fractions.
6.98 becomes 698/100
9.2 becomes 92/10
The least common denominator for the denominators of 7, 100 and 10 is 700. Now we can multiply each fraction with 700 as follows:
3/7*700=300
698/100*700=4886
10/7*700=1000
92/10*700=6440
In order from the smallest to largest, we organize the number set as follows:
3/7, 10/7, 6.98, 9.2.
Thus, 9.2 is the greatest of all.
Correct Answer is D
Explanation
Percentages are fractions with denominator equal to 100. To convert a percent to decimal form, divide the value by 100.
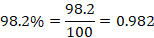
The decimal form of 98.2% is 0.982.
Correct Answer is C
Explanation
We follow the order of operations to solve the given expression. The order of operations is PEMDAS:
- Parentheses
- Exponents
- Multiplication and Division (in order from left to right)
- Addition and Subtraction (in order from left to right)
First, we start with the numerator and solve it as follows
[3(6+5*4)]
We start with multiplication in parenthesis, 5*4=20. The expression becomes
[3(6+20)]
Then, we conduct the addition in parenthesis 6+20=26. Then, the expression becomes
[3(26)]=3*26=78
Now, we solve for denominator, which is 26/2=13.
Thus, the expression is reduced into
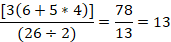
The expression reduces into 6.
Correct Answer is B
Explanation
To find the median of a data set, we need to first order the data from least to greatest, then find the middle value.
Step 1: Order the data from least to greatest:
The original data set is:
12,19,7,14,22,26,15
Ordered from least to greatest:
7,12,14,15,19,22,26
Step 2: Find the middle value
Since there are 7 numbers (an odd number of data points), the median will be the middle value, which is the 4th number in the ordered list.
7,12,14,15,19,22,26
The middle value is 15.
Conclusion:
The median of the data set is 15.
The correct answer is B. 15.
This question was extracted from the actual TEAS Exam. Ace your TEAS exam with the actual TEAS 7 questions, Start your journey with us today
Visit Naxlex, the Most Trusted TEAS TEST Platform With Guaranteed Pass of 90%.
Money back guarantee if you use our service and fail the actual exam. Option of personalised live tutor on your area of weakness.