Which of the following options correctly orders the numbers below from least to greatest?
235.971, 145.884, -271.906, -193.823
-271.906, -193.823, 145.884, 235.971
-271.971, 235.971, -193.823, 145.884
145.884, -193.823, 235.971, -271.906
-193.823, -271.906, 145.884, 235.971
Correct Answer : A
From the given options, we can arrange the numbers from the smallest to the largest as:
-271.906, -193.823, 145.884, 235.971
From the above, it can be noted that -271 is less than -193 while 235 is more than 145.
TEAS 7 Exam Quiz Bank
HESI A2 Exam Quiz Bank
Find More Questions 📚
Teas 7 Questions: We got the latest updated TEAS 7 questions
100% Money Refund: 100% money back guarantee if you take our full
assessment pass with 80% and fail the actual exam.
Live Tutoring: Fully customized live tutoring lessons.
Guaranteed A Grade: All students who use our services pass with 90%
guarantee.
Related Questions
Correct Answer is B
Explanation
total muffin is equal to the sum of the different muffins sold.
Total muffins=41+27+20=88 muffins
Thus, the bakery sold about 90 muffins.
Correct Answer is B
Explanation
we are asked to change 400 mg to g. We use the conversion 1g=1000mg, which we can write as:

So, 400 mg to g becomes
Correct Answer is D
Explanation
The given ratio of yoghurt to toppings is 4:3, meaning:
Yoghurt : toppings =4 : 3
We are given 4.5 oz of toppings and need to find the amount of yoghurt.
Step 1: Set up the proportion
 =
= 
Step 2: Solve for yoghurt
Multiply both sides by 4.5:
yoghurt=43×4.5
yoghurt=4×4.5/3=18/3=6oz
Correct Answer is D
Explanation
To answer this question, we need to observe the trend of the number of days with dollars. On day 2, the dollars were 8, after 5 days, the dollars decreased to 3, after 13 days, the dollars increased to 10. After 14 days, the dollars declined to 6 and again rose to 16 dollars after 19 days.
From this observation, we cannot be able to establishany correlation between days and dollars.
Correct Answer is B
Explanation
The median temperature can be found by organizing the temperature values from the smallest to the largest value as follows:
98.6, 98.7, 99.0, 99.0,99.2, 99.3, 99.7, 100.0
(for an even set of numbers, Median = frac{(frac{n}{2})th observation + (frac{n}{2} + 1) th observation}{2})
From the data set above, there are 8temperature values. The median is the temperature value in the middle position, which falls between the(frac{n}{2} th)and((frac{n}{2} + 1) th) position. Here N=8and median is found as:
(frac{(frac{n}{2})th + (frac{n}{2} + 1) th}{2} = )(frac{(frac{8}{2})th + (frac{8}{2} + 1) th }{2} = 4.5th position)
The element in the 4.5th position is the average of the 4th and 5th element.
(frac{99.0 + 99.2}{2} = 99.1)
Thus 99.1 is the median temperature.
Correct Answer is A
Explanation
Here we collect like terms together and solve for the unknown value of x.
7x-6=3x-26
Add 6 to both sides of the equation
7x-6+6=3x-26+6
7x=3x-20
Subtract 3x from both sides of the equation
7x-3x=-20
4x=-20
Divide both sides by 4
4x/-4=-20/4
x = -5
The value of x = -5
Correct Answer is C
Explanation
We extrapolate the values of a line between 10 and 15 on y-axis to meet the curve and drop another line from the intersection of the curve to meet the x-axis and read off the age of the car.
Now, let’s extrapolate in the following diagram
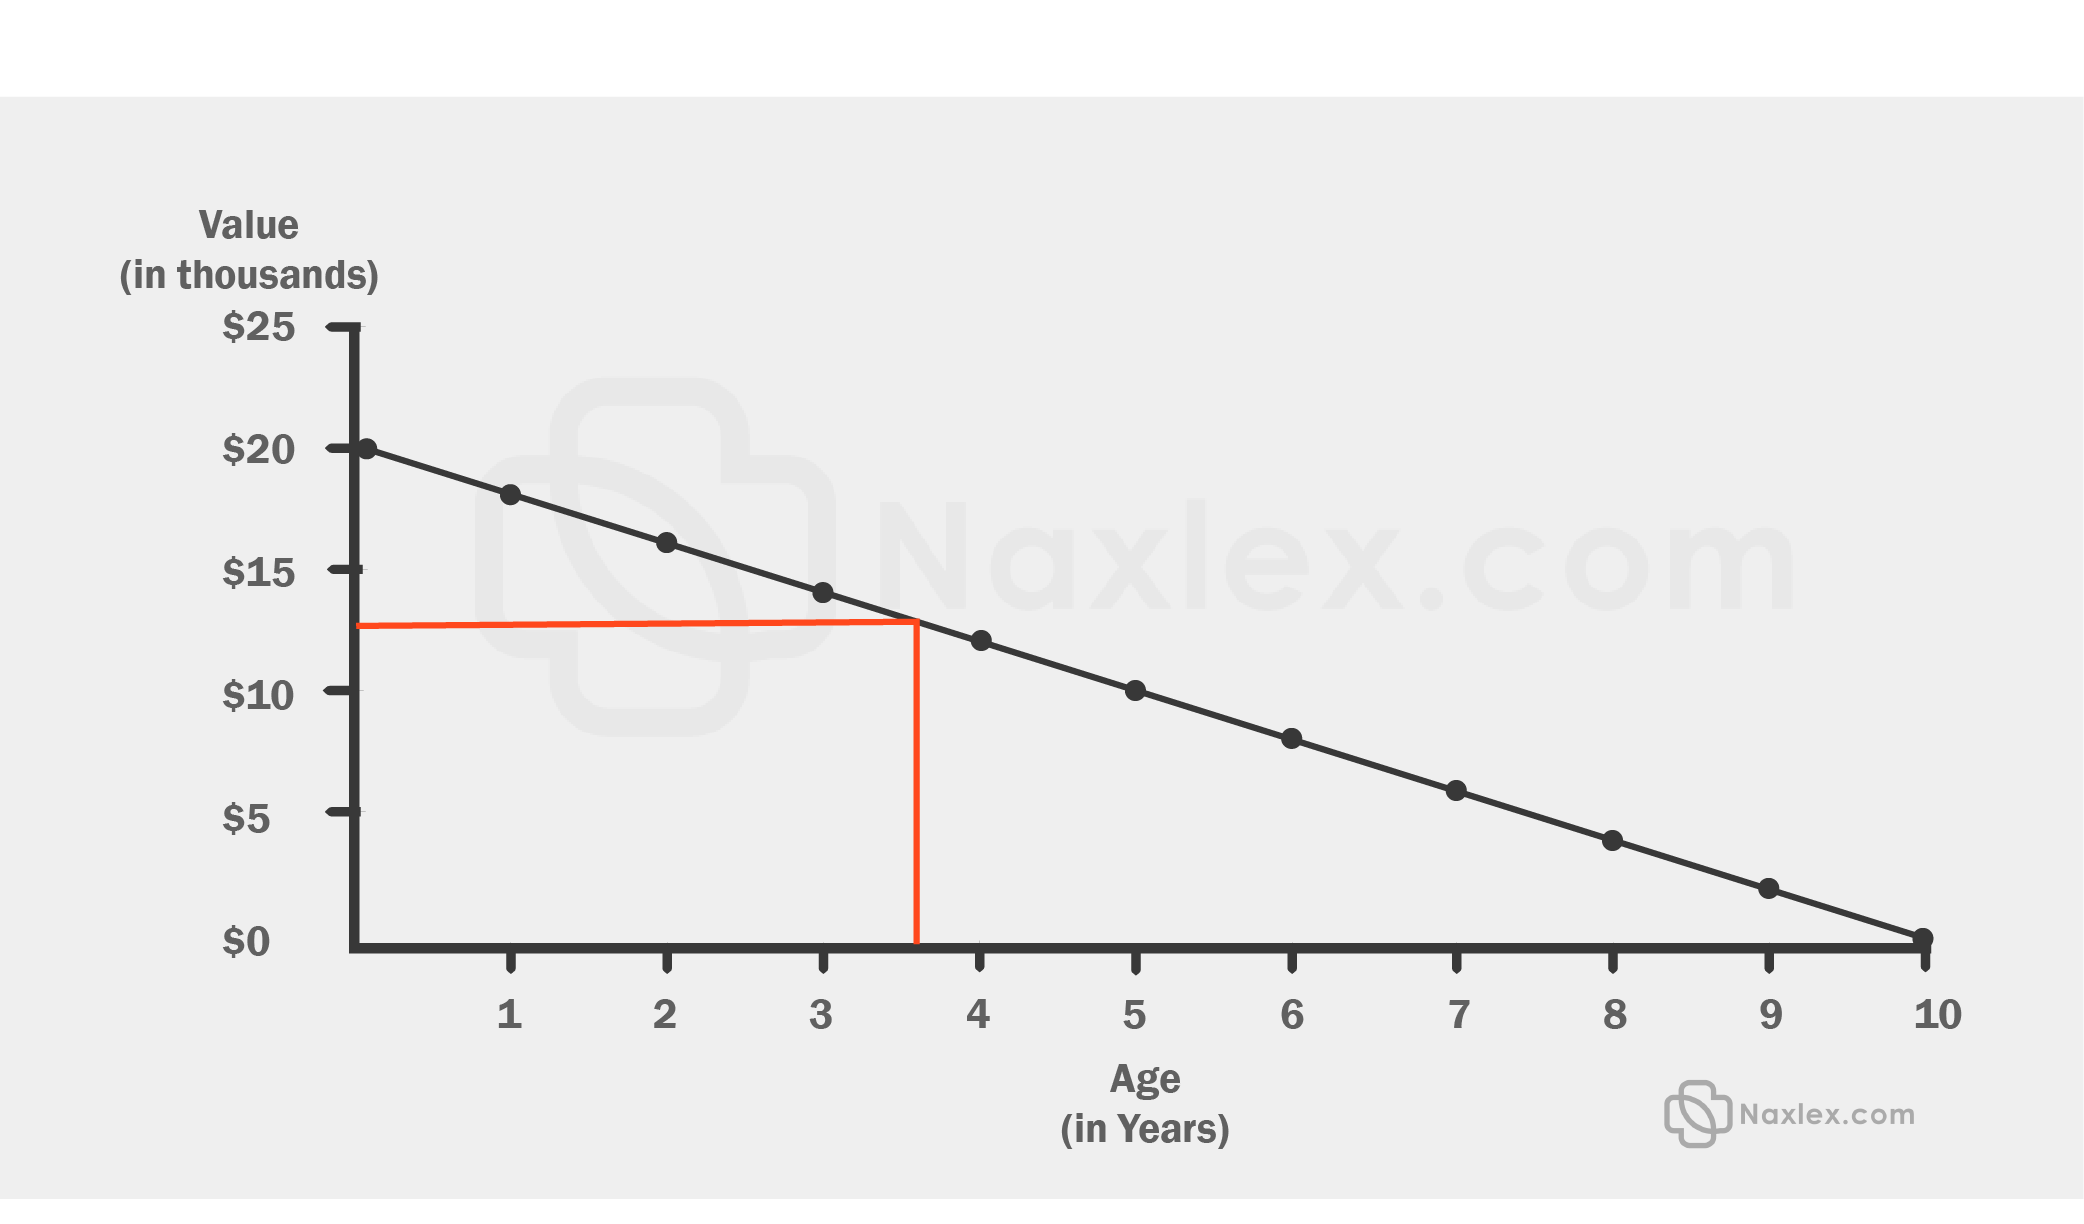
The intersection of the line and the x-axis is between 4 and 5 years. This means that the car is about 4.5 years old. From the options given, the age of the car is more than 3 years old.
Correct Answer is B
Explanation
In the simple interest, we utilize the following formula to find the simple interest after a period of time in years.
I=P*r*t
I is the interest
P=Principal or initial deposit
r=rate
t=time in years
From the given problem, P=$600, r=6%=6/100=0.06, t=5 years. Then
I=$600*0.06*5=$180
After 5 years, Pat will earn an interest of $180.
Correct Answer is B
Explanation
A dependent variable is one that when another variable changes, it also changes. In our case, the insurance premium changes if the age, model, mileage of car changes. Thus, insurance premium is the dependent variable while the other three are independent variable.
Correct Answer is A
Explanation
From the given problem,
49.5 pounds of fertilizer is needed to farm 1 acre of land. This can be interpreted as:

Or

Now we are needed to find the acres of land that will be farmed using 2000 pounds of fertilizers. To solve this, we use the second option as follows:

2000 pounds of fertilizers can farm approximately 40 acres of land.
This question was extracted from the actual TEAS Exam. Ace your TEAS exam with the actual TEAS 7 questions, Start your journey with us today
Visit Naxlex, the Most Trusted TEAS TEST Platform With Guaranteed Pass of 90%.
Money back guarantee if you use our service and fail the actual exam. Option of personalised live tutor on your area of weakness.