Which of the following percentages is equivalent to the fraction below?
3/4
57%
7.5%
65%
75%
Correct Answer : D
to convert fraction to percent, multiply the fraction with 100%. Therefore, the percent equivalent of 3/4 is
3/4*100%=75%
Thus, 3/4 is equal to 75%.
TEAS 7 Exam Quiz Bank
HESI A2 Exam Quiz Bank
Find More Questions 📚
Teas 7 Questions: We got the latest updated TEAS 7 questions
100% Money Refund: 100% money back guarantee if you take our full
assessment pass with 80% and fail the actual exam.
Live Tutoring: Fully customized live tutoring lessons.
Guaranteed A Grade: All students who use our services pass with 90%
guarantee.
Related Questions
Correct Answer is B
Explanation
We follow the order operations to solve for the unknown value of x.
3(2x+5)=11x+5
Open the bracket on the LHS by multiplying each term by 3
(3*2x)+(3*5)=11x+5
6x+15=11x+5
Subtract 15 from both sides
6x+15-15=11x+5-15
6x=11x-10
Subtract 11x on both sides
6x-11x=11x-11x-10
-5x=-10
Divide both sides by -5
-5x/-5=-10/-5
x= 2
Thus, the value of unknown value of x is 2.
Correct Answer is B
Explanation
to find the average time the athlete runs in 1 mile, find total time divided by total distance covered in the two runs.
Total distance=5+3=8 miles
Total time=25+15=40 minutes
We now know that the athlete runs 8 miles in 40 minutes, so the time the athlete will run in 1 mile will be:
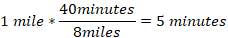
In 5 minutes, the athlete runs 1 mile.
Correct Answer is A
Explanation
: We need to find the total rainfall for the months of May, June, and July using the given graph.
In the month of May, rainfall is between 3 and 4, which is halfway. Therefore, rainfall in May is 3.5 inches
On June, rainfall was 3 inch and on July the rainfall was 2.5 inches. Thus,
Total rainfall=3.5 inches+3 inches+ 2.5 inches=9.0 inches
Correct Answer is D
Explanation
The babies' measured weights change over time and depend on the time interval after birth. Since weight is the outcome being measured, it is the dependent variable in the study.
Correct Answer is A
Explanation
The length of the unknown side of the rectangle can be found by using the Pythagoras theorem. Letting the unknown side to be x, the labelled rectangle becomes: The unknown length of the triangle is about 16.7 feet.
The length of the unknown side of the rectangle can be found by using the Pythagoras theorem. Letting the unknown side to be x, the labelled rectangle becomes: 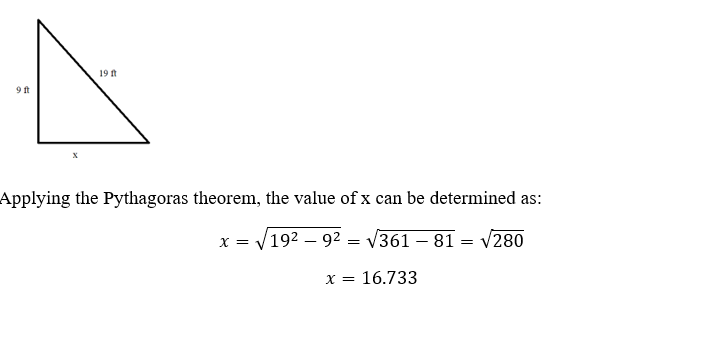
The unknown length of the triangle is about 16.7 feet.
Correct Answer is D
Explanation
: we are needed to find the portion of burger the two other friends share between themselves. A whole burger is 1, and we know that,
One friend=1/4 of 1=1/4*1=1/4
Remaining amount=1-1/4=4/4-1/4=3/4
Thus, ¾ of burger is left for two friends to share among themselves. Then, each friend will get
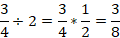
So, the other two friends will each get 3/8 of the burger.
Correct Answer is D
Explanation
When solving percent problems, the following words and their meaning becomes handy.
- Is means equals
- Of means multiply
- What means unknown (variable)
If we let x represent the amount of tip the couple want to leave behind, then
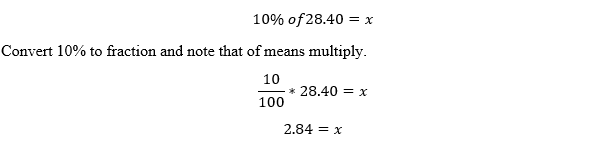
So, the couple will leave a tip of $2.84, which is about $3.00
Correct Answer is C
Explanation
We asked to convert kg to pounds. There are two ways of converting between kg and pounds

And

Since we are to find pounds, we use the second option for kg to cancel
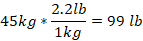
The pound equivalent of 45 kg is 99 lb.
Correct Answer is D
Explanation
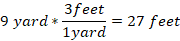
The interconversion of yards to feet utilizes the relationship 1 yard =3 feet. Then, 9 yards to ft becomes
 t
t
There, 9 yards is equal to 27 ft.
Correct Answer is A
Explanation
To form an equation from the word problem, first break the given statement into smaller statements.
First, we are given the width of the rectangle as x. We are told, the length is two times width. Mathematically, this means
Length=2*width=2*x=2x
Now, the length is 6 less than 2 times width of the rectangle. Thus, the length of rectangle in terms of width becomes:
Length =2x-6
Thus, the length of the rectangle is 2x-6.
This question was extracted from the actual TEAS Exam. Ace your TEAS exam with the actual TEAS 7 questions, Start your journey with us today
Visit Naxlex, the Most Trusted TEAS TEST Platform With Guaranteed Pass of 90%.
Money back guarantee if you use our service and fail the actual exam. Option of personalised live tutor on your area of weakness.