Which of the following relationships represents a negative correlation between two variables?
As a student’s class attendance decreases, the student’s overall grade remains the same
As the number of hours a person exercises decreases, the weight of that person remains unchanged
As the number of miles driven increases, the amount of the gasoline in the tank decreases
As the amount of water plant receives increases, the growth rate of the plant increase.
Correct Answer : C
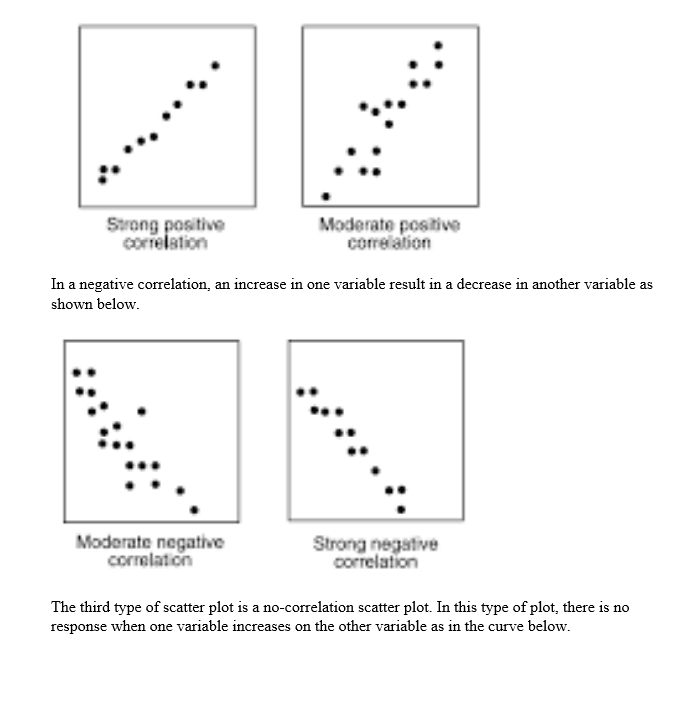
Correlation of two variables falls into:
Positive correlation: an increase in one variable causes another variable to increase
Negative correlation: an increase in one variable causes another one to decrease
No correlation: a change in one variable does not cause any response in another variable.
From the given choices
Option a is no correlation
Option b is a no correlation
Option c is a negative correlation
Option d is a positive correlation
TEAS 7 Exam Quiz Bank
HESI A2 Exam Quiz Bank
Find More Questions 📚
Teas 7 Questions: We got the latest updated TEAS 7 questions
100% Money Refund: 100% money back guarantee if you take our full
assessment pass with 80% and fail the actual exam.
Live Tutoring: Fully customized live tutoring lessons.
Guaranteed A Grade: All students who use our services pass with 90%
guarantee.
Related Questions
Correct Answer is C
Explanation
In this problem, we need to find the amount of gratuity the couple will leave. The gratuity is 16% of the total bill. Before solving the problem, the following are terms and their meaning in percent problems:
- Is means equals
- Of means multiply
- What means unknown (variable)
If we let x be the amount of gratuity, then translating the given problem into a mathematical equation becomes:
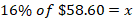
Now we evaluate the above equation noting that of means multiply.
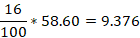
So, the value of x=9.376 and to the nearest cent, x=9.38
There, a couple will leave a gratuity of $9.38.
Correct Answer is D
Explanation
In order for the teacher to better visualize the test performance for his class, he needs to present the mark distribution in chart form. A better chart visualizer is the histogram, which will show the frequency of marks against range of test scores. A bar graph will not be used because the rectangles need to touch one another.
In a bar graph, the rectangles do not touch each other. Therefore, it will not be a good chart visualizer.
Correct Answer is A
Explanation
A ratio is of the form a : b but can also be converted to a fraction of the form a/b, where b is not equal to zero. Besides, to in ration means per in fraction form.
In the class of 40 students, 22 are girls and 18 are boys. Thus, the ratio of girls to boys becomes:

The above fraction can be reduced further since 2 is a common factor in both 22 and 18. Thus
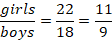
In ratio form, girls: boys=11:9
Thus, the ratio of girls to boys in a class of 40 students is 11 to 9.
Correct Answer is D
Explanation
Scatter plots can depict three correlations: positive, negative and no correlation. A positive correlation scatter plot reveals that as one variable increases, the other variable also increases as shown below
Correct Answer is D
Explanation
To solve the equation this equation, we compute the multiplication of the two numbers using the calculator
3.60 * 0.75 = 2.7
Correct Answer is D
Explanation
We use the order of operation to solve for the unknown value of x.
3(3x+3)=8x+5
Multiply 3 with each number in the brackets
(3*3x)+(3*3)=8x+5
9x+9=8x+5
Subtract 9 from both sides
9x+9-9=8x+5-9
9x=8x-4
Subtract 8x on both sides
9x-8x=8x-8x-4
x=-4
Thus, the unknown value of x is -4.
Correct Answer is D
Explanation
Before finding the area of the pizza, we need to find the radius of the pizza.
Find radius of the pizza in terms of diameter
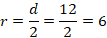
Next, find area of the pizza using the radius of 6 inches

Substituting r=6 in the equation of the area of a circle
Thus, the pizza has an area of 36 π in2.
Correct Answer is C
Explanation
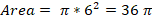
A whole pizza represents 1, and two friends eat ¼ of the pizza. The remaining fraction of pizza is:
Remaining amount = 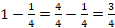
Thus, 3/4 of pizza is left for three friends to share equally.
Now, the other three friends will each get
So, the other three friends will each get 1/4 of the pizza.
Correct Answer is C
Explanation
Let x be the original price of the recliner.
Step 1: Apply the 30% discount
The recliner is on sale for 30% less than the original price:
SalePrice=x−0.3x=0.7x
Step 2: Apply the 25% coupon discount
The consumer gets an additional 25% off the sale price:
FinalPrice=0.7x−0.25(0.7x) = 0.525x
Step 3: Solve for x
The consumer paid $237, so:
0.525x=237
x≈451.43x
Rounding to the nearest dollar, the original price is $451.
Correct Answer is A
Explanation
We analyze the given statement with the graph given as follows:
For option a: the points per game decreased five times between 1996 and 2015. So, the statement is true.
For option b: the lowest points scored per game was in 1998-99 season. So, the statement is false.
For option c: 2008-09 was the season the chargers scored the greatest number of points per game and not 2002-03 as claimed in the statement. So, this statement is not true.
This question was extracted from the actual TEAS Exam. Ace your TEAS exam with the actual TEAS 7 questions, Start your journey with us today
Visit Naxlex, the Most Trusted TEAS TEST Platform With Guaranteed Pass of 90%.
Money back guarantee if you use our service and fail the actual exam. Option of personalised live tutor on your area of weakness.