To rent tablecloth from a rental vendor, there is an initial charge of $40. There is an additional charge of $5 per circular tablecloth (c) and $3.50 per rectangular tablecloth (r). Which of the following represents the total cost (T) to rent tablecloths?
5r + 3.5c - 40 = T
5c + 3.5r + 40 = T
5c + 3.5r - 40 = T
5r + 3.5c + 40 = T
Correct Answer : B
From the given scenario:
Initial charge is $40
Additional charge per circular cloth=$5c
Additional charge per rectangular cloth=$3.50r
Total cost = additional charge per circular rectangular cloths + Initial charge
Total cost, T = 5c + 3.5r + 40
TEAS 7 Exam Quiz Bank
HESI A2 Exam Quiz Bank
Find More Questions 📚
Teas 7 Questions: We got the latest updated TEAS 7 questions
100% Money Refund: 100% money back guarantee if you take our full
assessment pass with 80% and fail the actual exam.
Live Tutoring: Fully customized live tutoring lessons.
Guaranteed A Grade: All students who use our services pass with 90%
guarantee.
Related Questions
Correct Answer is B
Explanation
total muffin is equal to the sum of the different muffins sold.
Total muffins=41+27+20=88 muffins
Thus, the bakery sold about 90 muffins.
Correct Answer is A
Explanation
We are given a mix of fractions and decimals and to compare the numbers, we convert the given decimals to fractions.
4.4 becomes 44/10
4.25 becomes 425/100
Now the set of fractions for comparison are: 9/2, 10/3, 44/10, and 425/100. The least common denominator for 2, 3 and 10 is 300. Then,
9/2*300=1350
10/3*300=1000
44/10*300=1320
425/10*300=1275
From the above products, 9/2 gives the greatest value when the fractions are compared with the least common denominator of the given denominators.
Correct Answer is D
Explanation
The mean is the total divided by the number of elements in the data set. From the given data set:
Total=30+29+28+30+24+12+26+33+25+23=260
Number of items, N=10
Mean=total/N=260/10=26
The mean is 26.
Correct Answer is D
Explanation
To answer this question, we need to observe the trend of the number of days with dollars. On day 2, the dollars were 8, after 5 days, the dollars decreased to 3, after 13 days, the dollars increased to 10. After 14 days, the dollars declined to 6 and again rose to 16 dollars after 19 days.
From this observation, we cannot be able to establishany correlation between days and dollars.
Correct Answer is A
Explanation
We need to find the length of the rectangle from the given area and width of the rectangle. Let L be length if the rectangle. Then,
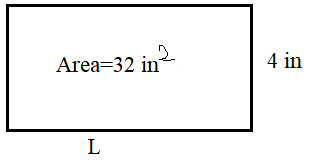
Area of rectangle=Length*width
Substituting area=32 in2 and w=4 inches
32=L*4
32=4L
Divide both sides by 4
32/4=4L/4
8=L
The length of the rectangle is 8 inches.
Correct Answer is A
Explanation
In this problem, we take the triangle as a right-angled triangle and label it as follows:
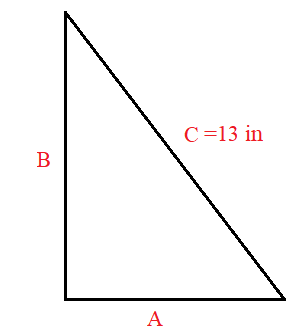
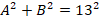
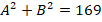
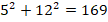
From the Pythagoras theorem A2 + B2= C2, we can look for a combination of A and B that when the squares of A and B are summed give a square of 13. Mathematically,

But C=13 inches
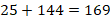
If we take A=5 inches and B=12 inches, then

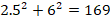
Next, we take A=2.5 inches, B=6 inches


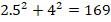
Next, we take A=2.5 inches, B=4 inches
6.25+16=169
22.25≠169
Taking A=5 inches and B=8 inches


From the above computation, the combination of A=5 inches and B=12 inches give a triangle with a hypothenuse of 13 inches.
Correct Answer is B
Explanation
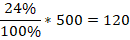
The whole pie chart represents 100%, which we use together with the given percentages to find the respective different sports. Note that 100% is equal to 500 surveyed students. The, the number of teenagers who prefer:
Soccer
Hockey
Football
Basketball
Other
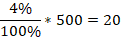
From the evaluations above, 90 teenagers love soccer, 80 love hockey, 190 teenagers love football, 120 teenagers love basketball, and 20 teenagers love others.
Correct Answer is D
Explanation
The given ratio of yoghurt to toppings is 4:3, meaning:
Yoghurt : toppings =4 : 3
We are given 4.5 oz of toppings and need to find the amount of yoghurt.
Step 1: Set up the proportion
 =
= 
Step 2: Solve for yoghurt
Multiply both sides by 4.5:
yoghurt=43×4.5
yoghurt=4×4.5/3=18/3=6oz
Correct Answer is A
Explanation
We are given that 1 teaspoon=4.93 mL, we can interpret it as:

Or

Since we are to find the amount in mL, we look for an option that will cancel teaspoon and remain with mL. The second option is the required conversion, and we proceed as follows:
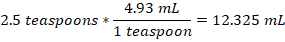
Therefore, 2.5 teaspoons hold about 12.325 mL.
Correct Answer is B
Explanation
from the provided table, the first option represents the amount of gas in gallons while the second column shows the distance in miles. Thus, (6, 144) will denote that the car can 144 miles by consuming 6 gallons of a gas.
This question was extracted from the actual TEAS Exam. Ace your TEAS exam with the actual TEAS 7 questions, Start your journey with us today
Visit Naxlex, the Most Trusted TEAS TEST Platform With Guaranteed Pass of 90%.
Money back guarantee if you use our service and fail the actual exam. Option of personalised live tutor on your area of weakness.